Gene family expansion/contraction
Maeva Techer
2026-04-06
Last updated: 2026-04-06
Checks: 6 1
Knit directory:
locust-comparative-genomics/
This reproducible R Markdown analysis was created with workflowr (version 1.7.2). The Checks tab describes the reproducibility checks that were applied when the results were created. The Past versions tab lists the development history.
Great! Since the R Markdown file has been committed to the Git repository, you know the exact version of the code that produced these results.
Great job! The global environment was empty. Objects defined in the global environment can affect the analysis in your R Markdown file in unknown ways. For reproduciblity it’s best to always run the code in an empty environment.
The command set.seed(20221025) was run prior to running
the code in the R Markdown file. Setting a seed ensures that any results
that rely on randomness, e.g. subsampling or permutations, are
reproducible.
Great job! Recording the operating system, R version, and package versions is critical for reproducibility.
Nice! There were no cached chunks for this analysis, so you can be confident that you successfully produced the results during this run.
Using absolute paths to the files within your workflowr project makes it difficult for you and others to run your code on a different machine. Change the absolute path(s) below to the suggested relative path(s) to make your code more reproducible.
| absolute | relative |
|---|---|
| /Users/maevatecher/Documents/GitHub/locust-comparative-genomics/data/cafe5_results/Results_26May_iqtree/Base_change.tab | data/cafe5_results/Results_26May_iqtree/Base_change.tab |
| /Users/maevatecher/Documents/GitHub/locust-comparative-genomics/data/orthofinder/Polyneoptera/Results_I2_iqtree/Orthogroups/Orthogroups.GeneCount.tsv | data/orthofinder/Polyneoptera/Results_I2_iqtree/Orthogroups/Orthogroups.GeneCount.tsv |
| /Users/maevatecher/Documents/GitHub/locust-comparative-genomics/data/orthofinder/Polyneoptera/Results_I2_iqtree/Orthogroups_genesproteinbiotype_13species_annotated_May2025.csv | data/orthofinder/Polyneoptera/Results_I2_iqtree/Orthogroups_genesproteinbiotype_13species_annotated_May2025.csv |
| /Users/maevatecher/Documents/GitHub/locust-comparative-genomics/data/orthofinder/Polyneoptera | data/orthofinder/Polyneoptera |
| /Users/maevatecher/Documents/GitHub/locust-comparative-genomics/data | data |
| /Users/maevatecher/Documents/GitHub/locust-comparative-genomics/data/cafe5_results/Orthogroups.GeneCount.tsv | data/cafe5_results/Orthogroups.GeneCount.tsv |
Great! You are using Git for version control. Tracking code development and connecting the code version to the results is critical for reproducibility.
The results in this page were generated with repository version c5ee762. See the Past versions tab to see a history of the changes made to the R Markdown and HTML files.
Note that you need to be careful to ensure that all relevant files for
the analysis have been committed to Git prior to generating the results
(you can use wflow_publish or
wflow_git_commit). workflowr only checks the R Markdown
file, but you know if there are other scripts or data files that it
depends on. Below is the status of the Git repository when the results
were generated:
Ignored files:
    Ignored:    .DS_Store
    Ignored:    .Rhistory
    Ignored:    analysis/.DS_Store
    Ignored:    analysis/.Rhistory
    Ignored:    analysis/2_signatures-selection_cache/
    Ignored:    analysis/3_wgcna-network_cache/
    Ignored:    analysis/figure/
    Ignored:    code/.DS_Store
    Ignored:    code/scripts/.DS_Store
    Ignored:    code/scripts/pal2nal.v14/.DS_Store
    Ignored:    data/.DS_Store
    Ignored:    data/DEG_results/.DS_Store
    Ignored:    data/DEG_results/Bulk_RNAseq/.DS_Store
    Ignored:    data/DEG_results/Bulk_RNAseq/americana/.DS_Store
    Ignored:    data/DEG_results/Bulk_RNAseq/cancellata/.DS_Store
    Ignored:    data/DEG_results/Bulk_RNAseq/cubense/.DS_Store
    Ignored:    data/DEG_results/Bulk_RNAseq/gregaria/.DS_Store
    Ignored:    data/DEG_results/Bulk_RNAseq/nitens/.DS_Store
    Ignored:    data/DEG_results/RNAi/.DS_Store
    Ignored:    data/DEG_results/RNAi/All_control_no_rRNA/.DS_Store
    Ignored:    data/DEG_results/RNAi/Head/.DS_Store
    Ignored:    data/DEG_results/RNAi/Head_control/.DS_Store
    Ignored:    data/DEG_results/RNAi/Head_no_rRNA/.DS_Store
    Ignored:    data/DEG_results/RNAi/Thorax/.DS_Store
    Ignored:    data/HYPHY_selection/.DS_Store
    Ignored:    data/HYPHY_selection/ParsedABSRELResults_unlabeled/.DS_Store
    Ignored:    data/HYPHY_selection/functional_pathways/.DS_Store
    Ignored:    data/HYPHY_selection/functional_pathways/aBSREL/.DS_Store
    Ignored:    data/HYPHY_selection/pathway_enrichment/.DS_Store
    Ignored:    data/HYPHY_selection/pathway_enrichment/americana/
    Ignored:    data/HYPHY_selection/pathway_enrichment/cancellata/
    Ignored:    data/HYPHY_selection/pathway_enrichment/cubense/
    Ignored:    data/HYPHY_selection/pathway_enrichment/nitens/
    Ignored:    data/HYPHY_selection/pathway_enrichment/piceifrons/
    Ignored:    data/WGCNA/.DS_Store
    Ignored:    data/WGCNA/input/.DS_Store
    Ignored:    data/WGCNA/input/Bulk_RNAseq/.DS_Store
    Ignored:    data/WGCNA/input/GRNs/.DS_Store
    Ignored:    data/WGCNA/output/.DS_Store
    Ignored:    data/WGCNA/output/Bulk_RNAseq/.DS_Store
    Ignored:    data/WGCNA/output/Bulk_RNAseq/americana/
    Ignored:    data/WGCNA/output/Bulk_RNAseq/gregaria/.DS_Store
    Ignored:    data/WGCNA/output/Bulk_RNAseq/gregaria/Head/
    Ignored:    data/WGCNA/output/Bulk_RNAseq/gregaria/Thorax/
    Ignored:    data/behavioral_data/.DS_Store
    Ignored:    data/behavioral_data/Raw_data/.DS_Store
    Ignored:    data/cafe5_results/.DS_Store
    Ignored:    data/cafe5_results/Base_change_FILE/.DS_Store
    Ignored:    data/cafe5_results/Base_change_FILE/americana/.DS_Store
    Ignored:    data/cafe5_results/Base_change_FILE/gregaria/.DS_Store
    Ignored:    data/cafe5_results/Base_change_FILE/locusta/.DS_Store
    Ignored:    data/cafe5_results/Gene_count_FILE/.DS_Store
    Ignored:    data/list/.DS_Store
    Ignored:    data/list/Bulk_RNAseq/.DS_Store
    Ignored:    data/list/GO_Annotations/.DS_Store
    Ignored:    data/list/GO_Annotations/DesertLocustR/.DS_Store
    Ignored:    data/list/excluded_loci/.DS_Store
    Ignored:    data/orthofinder/.DS_Store
    Ignored:    data/orthofinder/Polyneoptera/.DS_Store
    Ignored:    data/orthofinder/Polyneoptera/Results_I2_iqtree/.DS_Store
    Ignored:    data/orthofinder/Polyneoptera/Results_I2_iqtree/Orthogroups/.DS_Store
    Ignored:    data/orthofinder/Polyneoptera/Results_I2_withDaust/.DS_Store
    Ignored:    data/orthofinder/Polyneoptera/Results_I2_withDaust/Orthogroups/.DS_Store
    Ignored:    data/orthofinder/Schistocerca/.DS_Store
    Ignored:    data/orthofinder/Schistocerca/Results_I2/.DS_Store
    Ignored:    data/orthofinder/Schistocerca/Results_I2/Orthogroups/.DS_Store
    Ignored:    data/overlap/.DS_Store
    Ignored:    data/pathway_enrichment/.DS_Store
    Ignored:    data/pathway_enrichment/OLD/.DS_Store
    Ignored:    data/pathway_enrichment/OLD/custom_sgregaria_orgdb/.DS_Store
    Ignored:    data/pathway_enrichment/REVIGO_results/.DS_Store
    Ignored:    data/pathway_enrichment/REVIGO_results/BP/.DS_Store
    Ignored:    data/pathway_enrichment/REVIGO_results/CC/.DS_Store
    Ignored:    data/pathway_enrichment/REVIGO_results/MF/.DS_Store
    Ignored:    data/pathway_enrichment/americana/.DS_Store
    Ignored:    data/pathway_enrichment/cancellata/.DS_Store
    Ignored:    data/pathway_enrichment/gregaria/.DS_Store
    Ignored:    data/pathway_enrichment/nitens/Thorax/
    Ignored:    data/pathway_enrichment/piceifrons/.DS_Store
    Ignored:    data/readcounts/.DS_Store
    Ignored:    data/readcounts/Bulk_RNAseq/.DS_Store
    Ignored:    data/readcounts/RNAi/.DS_Store

Untracked files:
    Untracked:  analysis/bustedPH_logomega3_scatter_nosuspect.pdf
    Untracked:  bustedPH_logomega3_scatter_nosuspect.pdf
    Untracked:  data/HYPHY_selection/functional_pathways/BUSTED_unlabeled/
    Untracked:  data/RefSeq/
    Untracked:  data/WGCNA/output/Bulk_RNAseq/cancellata/
    Untracked:  data/WGCNA/output/Bulk_RNAseq/gregaria/ModuleTraitRelationships_Head_gregaria_with_colors_name_filter.pdf
    Untracked:  data/WGCNA/output/Bulk_RNAseq/piceifrons/
    Untracked:  data/orthofinder/Polyneoptera/Results_I2_iqtree/trusted_ogs_v2.txt

Unstaged changes:
    Deleted:    analysis/2_hic-snps-phylogeny.Rmd
    Modified:   analysis/3_wgcna-network.Rmd
    Modified:   analysis/4_RNAi_behavior.Rmd
    Modified:   analysis/_site.yml
    Modified:   data/HYPHY_selection/ParsedABSRELResults_unlabeled/heatmap_significant_orthogroups.pdf
    Modified:   data/HYPHY_selection/ParsedABSRELResults_unlabeled/tree_colored_by_omega3_allbranches_FINAL.pdf
    Modified:   data/HYPHY_selection/functional_pathways/aBSREL/americana/GO_BP_dotplot_americana_aBSREL.pdf
    Modified:   data/HYPHY_selection/functional_pathways/aBSREL/americana/GO_CC_dotplot_americana_aBSREL.pdf
    Modified:   data/HYPHY_selection/functional_pathways/aBSREL/americana/GO_MF_dotplot_americana_aBSREL.pdf
    Modified:   data/HYPHY_selection/functional_pathways/aBSREL/americana/KEGG_dotplot_americana_aBSREL.pdf
    Modified:   data/HYPHY_selection/functional_pathways/aBSREL/americana/KEGG_enrichment_americana_aBSREL.csv
    Modified:   data/HYPHY_selection/functional_pathways/aBSREL/americana/enrich_KEGG_americana_aBSREL.txt
    Modified:   data/HYPHY_selection/functional_pathways/aBSREL/cancellata/GO_BP_dotplot_cancellata_aBSREL.pdf
    Modified:   data/HYPHY_selection/functional_pathways/aBSREL/cancellata/GO_CC_dotplot_cancellata_aBSREL.pdf
    Modified:   data/HYPHY_selection/functional_pathways/aBSREL/cancellata/GO_MF_dotplot_cancellata_aBSREL.pdf
    Modified:   data/HYPHY_selection/functional_pathways/aBSREL/cancellata/KEGG_dotplot_cancellata_aBSREL.pdf
    Modified:   data/HYPHY_selection/functional_pathways/aBSREL/cancellata/KEGG_enrichment_cancellata_aBSREL.csv
    Modified:   data/HYPHY_selection/functional_pathways/aBSREL/cancellata/enrich_KEGG_cancellata_aBSREL.txt
    Modified:   data/HYPHY_selection/functional_pathways/aBSREL/cubense/GO_BP_dotplot_cubense_aBSREL.pdf
    Modified:   data/HYPHY_selection/functional_pathways/aBSREL/cubense/GO_CC_dotplot_cubense_aBSREL.pdf
    Modified:   data/HYPHY_selection/functional_pathways/aBSREL/cubense/GO_MF_dotplot_cubense_aBSREL.pdf
    Modified:   data/HYPHY_selection/functional_pathways/aBSREL/cubense/KEGG_dotplot_cubense_aBSREL.pdf
    Modified:   data/HYPHY_selection/functional_pathways/aBSREL/cubense/KEGG_enrichment_cubense_aBSREL.csv
    Modified:   data/HYPHY_selection/functional_pathways/aBSREL/cubense/enrich_KEGG_cubense_aBSREL.txt
    Modified:   data/HYPHY_selection/functional_pathways/aBSREL/gregaria/GO_BP_dotplot_gregaria_aBSREL.pdf
    Modified:   data/HYPHY_selection/functional_pathways/aBSREL/gregaria/GO_CC_dotplot_gregaria_aBSREL.pdf
    Modified:   data/HYPHY_selection/functional_pathways/aBSREL/gregaria/GO_MF_dotplot_gregaria_aBSREL.pdf
    Modified:   data/HYPHY_selection/functional_pathways/aBSREL/gregaria/KEGG_dotplot_gregaria_aBSREL.pdf
    Modified:   data/HYPHY_selection/functional_pathways/aBSREL/gregaria/KEGG_enrichment_gregaria_aBSREL.csv
    Modified:   data/HYPHY_selection/functional_pathways/aBSREL/gregaria/enrich_KEGG_gregaria_aBSREL.txt
    Modified:   data/HYPHY_selection/functional_pathways/aBSREL/nitens/GO_BP_dotplot_nitens_aBSREL.pdf
    Modified:   data/HYPHY_selection/functional_pathways/aBSREL/nitens/GO_CC_dotplot_nitens_aBSREL.pdf
    Modified:   data/HYPHY_selection/functional_pathways/aBSREL/nitens/GO_MF_dotplot_nitens_aBSREL.pdf
    Modified:   data/HYPHY_selection/functional_pathways/aBSREL/nitens/KEGG_dotplot_nitens_aBSREL.pdf
    Modified:   data/HYPHY_selection/functional_pathways/aBSREL/nitens/KEGG_enrichment_nitens_aBSREL.csv
    Modified:   data/HYPHY_selection/functional_pathways/aBSREL/nitens/enrich_KEGG_nitens_aBSREL.txt
    Modified:   data/HYPHY_selection/functional_pathways/aBSREL/piceifrons/GO_BP_dotplot_piceifrons_aBSREL.pdf
    Modified:   data/HYPHY_selection/functional_pathways/aBSREL/piceifrons/GO_CC_dotplot_piceifrons_aBSREL.pdf
    Modified:   data/HYPHY_selection/functional_pathways/aBSREL/piceifrons/GO_MF_dotplot_piceifrons_aBSREL.pdf
    Modified:   data/HYPHY_selection/functional_pathways/aBSREL/piceifrons/KEGG_dotplot_piceifrons_aBSREL.pdf
    Modified:   data/HYPHY_selection/functional_pathways/aBSREL/piceifrons/KEGG_enrichment_piceifrons_aBSREL.csv
    Modified:   data/HYPHY_selection/functional_pathways/aBSREL/piceifrons/enrich_KEGG_piceifrons_aBSREL.txt
    Modified:   data/WGCNA/output/Bulk_RNAseq/gregaria/ModuleDendrogram_Head_gregaria.pdf
    Modified:   data/WGCNA/output/Bulk_RNAseq/gregaria/ModuleSizes_Head_gregaria.csv
    Modified:   data/WGCNA/output/Bulk_RNAseq/gregaria/ModuleSizes_Head_gregaria.pdf
    Modified:   data/WGCNA/output/Bulk_RNAseq/gregaria/ModuleTraitCorrelation_Head_gregaria.csv
    Modified:   data/WGCNA/output/Bulk_RNAseq/gregaria/ModuleTraitPValues_Head_gregaria.csv
    Modified:   data/WGCNA/output/Bulk_RNAseq/gregaria/ModuleTraitRelationships_Head_gregaria_with_colors.pdf
    Modified:   data/WGCNA/output/Bulk_RNAseq/gregaria/ModuleTraitRelationships_Head_gregaria_with_colors_name.pdf
    Modified:   data/WGCNA/output/Bulk_RNAseq/gregaria/SoftThreshold_Head_gregaria.pdf
    Modified:   data/WGCNA/output/Bulk_RNAseq/gregaria/network_Head_gregaria.rds
    Modified:   data/cafe5_results/Base_change_FILE/GO_BP_heatmap_top15_ExpVsCon.pdf
    Modified:   data/cafe5_results/Base_change_FILE/GO_CC_heatmap_top15_ExpVsCon.pdf
    Modified:   data/cafe5_results/Base_change_FILE/GO_MF_heatmap_top15_ExpVsCon.pdf
    Modified:   data/cafe5_results/Base_change_FILE/KEGG_subcategory_faceted_heatmap_Contraction.pdf
    Modified:   data/cafe5_results/Base_change_FILE/KEGG_subcategory_faceted_heatmap_Expansion.pdf
    Modified:   data/cafe5_results/Base_change_FILE/americana/Contraction/GO_BP_dotplot_americana_Contraction_cafe.pdf
    Modified:   data/cafe5_results/Base_change_FILE/americana/Contraction/GO_CC_dotplot_americana_Contraction_cafe.pdf
    Modified:   data/cafe5_results/Base_change_FILE/americana/Contraction/GO_MF_dotplot_americana_Contraction_cafe.pdf
    Modified:   data/cafe5_results/Base_change_FILE/americana/Contraction/KEGG_dotplot_americana_Contraction_cafe.pdf
    Modified:   data/cafe5_results/Base_change_FILE/americana/Contraction/KEGG_enrichment_americana_Contraction_cafe.csv
    Modified:   data/cafe5_results/Base_change_FILE/americana/Contraction/enrich_KEGG_americana_Contraction_cafe.txt
    Modified:   data/cafe5_results/Base_change_FILE/americana/Expansion/GO_BP_dotplot_americana_Expansion_cafe.pdf
    Modified:   data/cafe5_results/Base_change_FILE/americana/Expansion/GO_CC_dotplot_americana_Expansion_cafe.pdf
    Modified:   data/cafe5_results/Base_change_FILE/americana/Expansion/GO_MF_dotplot_americana_Expansion_cafe.pdf
    Modified:   data/cafe5_results/Base_change_FILE/americana/Expansion/KEGG_dotplot_americana_Expansion_cafe.pdf
    Modified:   data/cafe5_results/Base_change_FILE/americana/Expansion/KEGG_enrichment_americana_Expansion_cafe.csv
    Modified:   data/cafe5_results/Base_change_FILE/americana/Expansion/enrich_KEGG_americana_Expansion_cafe.txt
    Modified:   data/cafe5_results/Base_change_FILE/cancellata/Contraction/GO_BP_dotplot_cancellata_Contraction_cafe.pdf
    Modified:   data/cafe5_results/Base_change_FILE/cancellata/Contraction/GO_CC_dotplot_cancellata_Contraction_cafe.pdf
    Modified:   data/cafe5_results/Base_change_FILE/cancellata/Contraction/GO_MF_dotplot_cancellata_Contraction_cafe.pdf
    Modified:   data/cafe5_results/Base_change_FILE/cancellata/Contraction/KEGG_dotplot_cancellata_Contraction_cafe.pdf
    Modified:   data/cafe5_results/Base_change_FILE/cancellata/Contraction/KEGG_enrichment_cancellata_Contraction_cafe.csv
    Modified:   data/cafe5_results/Base_change_FILE/cancellata/Contraction/enrich_KEGG_cancellata_Contraction_cafe.txt
    Modified:   data/cafe5_results/Base_change_FILE/cancellata/Expansion/GO_BP_dotplot_cancellata_Expansion_cafe.pdf
    Modified:   data/cafe5_results/Base_change_FILE/cancellata/Expansion/GO_CC_dotplot_cancellata_Expansion_cafe.pdf
    Modified:   data/cafe5_results/Base_change_FILE/cancellata/Expansion/GO_MF_dotplot_cancellata_Expansion_cafe.pdf
    Modified:   data/cafe5_results/Base_change_FILE/cancellata/Expansion/KEGG_dotplot_cancellata_Expansion_cafe.pdf
    Modified:   data/cafe5_results/Base_change_FILE/cancellata/Expansion/KEGG_enrichment_cancellata_Expansion_cafe.csv
    Modified:   data/cafe5_results/Base_change_FILE/cancellata/Expansion/enrich_KEGG_cancellata_Expansion_cafe.txt
    Modified:   data/cafe5_results/Base_change_FILE/cubense/Contraction/GO_BP_dotplot_cubense_Contraction_cafe.pdf
    Modified:   data/cafe5_results/Base_change_FILE/cubense/Contraction/GO_CC_dotplot_cubense_Contraction_cafe.pdf
    Modified:   data/cafe5_results/Base_change_FILE/cubense/Contraction/GO_MF_dotplot_cubense_Contraction_cafe.pdf
    Modified:   data/cafe5_results/Base_change_FILE/cubense/Contraction/KEGG_dotplot_cubense_Contraction_cafe.pdf
    Modified:   data/cafe5_results/Base_change_FILE/cubense/Contraction/KEGG_enrichment_cubense_Contraction_cafe.csv
    Modified:   data/cafe5_results/Base_change_FILE/cubense/Contraction/enrich_KEGG_cubense_Contraction_cafe.txt
    Modified:   data/cafe5_results/Base_change_FILE/cubense/Expansion/GO_BP_dotplot_cubense_Expansion_cafe.pdf
    Modified:   data/cafe5_results/Base_change_FILE/cubense/Expansion/GO_CC_dotplot_cubense_Expansion_cafe.pdf
    Modified:   data/cafe5_results/Base_change_FILE/cubense/Expansion/GO_MF_dotplot_cubense_Expansion_cafe.pdf
    Modified:   data/cafe5_results/Base_change_FILE/cubense/Expansion/KEGG_dotplot_cubense_Expansion_cafe.pdf
    Modified:   data/cafe5_results/Base_change_FILE/cubense/Expansion/KEGG_enrichment_cubense_Expansion_cafe.csv
    Modified:   data/cafe5_results/Base_change_FILE/cubense/Expansion/enrich_KEGG_cubense_Expansion_cafe.txt
    Modified:   data/cafe5_results/Base_change_FILE/gregaria/Contraction/GO_BP_dotplot_gregaria_Contraction_cafe.pdf
    Modified:   data/cafe5_results/Base_change_FILE/gregaria/Contraction/GO_CC_dotplot_gregaria_Contraction_cafe.pdf
    Modified:   data/cafe5_results/Base_change_FILE/gregaria/Contraction/GO_MF_dotplot_gregaria_Contraction_cafe.pdf
    Modified:   data/cafe5_results/Base_change_FILE/gregaria/Contraction/KEGG_dotplot_gregaria_Contraction_cafe.pdf
    Modified:   data/cafe5_results/Base_change_FILE/gregaria/Contraction/KEGG_enrichment_gregaria_Contraction_cafe.csv
    Modified:   data/cafe5_results/Base_change_FILE/gregaria/Contraction/enrich_KEGG_gregaria_Contraction_cafe.txt
    Modified:   data/cafe5_results/Base_change_FILE/gregaria/Expansion/GO_BP_dotplot_gregaria_Expansion_cafe.pdf
    Modified:   data/cafe5_results/Base_change_FILE/gregaria/Expansion/GO_CC_dotplot_gregaria_Expansion_cafe.pdf
    Modified:   data/cafe5_results/Base_change_FILE/gregaria/Expansion/GO_MF_dotplot_gregaria_Expansion_cafe.pdf
    Modified:   data/cafe5_results/Base_change_FILE/gregaria/Expansion/KEGG_dotplot_gregaria_Expansion_cafe.pdf
    Modified:   data/cafe5_results/Base_change_FILE/gregaria/Expansion/KEGG_enrichment_gregaria_Expansion_cafe.csv
    Modified:   data/cafe5_results/Base_change_FILE/gregaria/Expansion/enrich_KEGG_gregaria_Expansion_cafe.txt
    Modified:   data/cafe5_results/Base_change_FILE/locusta/Contraction/GO_BP_dotplot_locusta_Contraction_cafe.pdf
    Modified:   data/cafe5_results/Base_change_FILE/locusta/Contraction/GO_CC_dotplot_locusta_Contraction_cafe.pdf
    Modified:   data/cafe5_results/Base_change_FILE/locusta/Contraction/GO_MF_dotplot_locusta_Contraction_cafe.pdf
    Modified:   data/cafe5_results/Base_change_FILE/locusta/Contraction/KEGG_dotplot_locusta_Contraction_cafe.pdf
    Modified:   data/cafe5_results/Base_change_FILE/locusta/Contraction/KEGG_enrichment_locusta_Contraction_cafe.csv
    Modified:   data/cafe5_results/Base_change_FILE/locusta/Contraction/enrich_KEGG_locusta_Contraction_cafe.txt
    Modified:   data/cafe5_results/Base_change_FILE/locusta/Expansion/GO_BP_dotplot_locusta_Expansion_cafe.pdf
    Modified:   data/cafe5_results/Base_change_FILE/locusta/Expansion/GO_CC_dotplot_locusta_Expansion_cafe.pdf
    Modified:   data/cafe5_results/Base_change_FILE/locusta/Expansion/GO_MF_dotplot_locusta_Expansion_cafe.pdf
    Modified:   data/cafe5_results/Base_change_FILE/locusta/Expansion/KEGG_dotplot_locusta_Expansion_cafe.pdf
    Modified:   data/cafe5_results/Base_change_FILE/locusta/Expansion/KEGG_enrichment_locusta_Expansion_cafe.csv
    Modified:   data/cafe5_results/Base_change_FILE/locusta/Expansion/enrich_KEGG_locusta_Expansion_cafe.txt
    Modified:   data/cafe5_results/Base_change_FILE/nitens/Contraction/GO_BP_dotplot_nitens_Contraction_cafe.pdf
    Modified:   data/cafe5_results/Base_change_FILE/nitens/Contraction/GO_CC_dotplot_nitens_Contraction_cafe.pdf
    Modified:   data/cafe5_results/Base_change_FILE/nitens/Contraction/GO_MF_dotplot_nitens_Contraction_cafe.pdf
    Modified:   data/cafe5_results/Base_change_FILE/nitens/Contraction/KEGG_dotplot_nitens_Contraction_cafe.pdf
    Modified:   data/cafe5_results/Base_change_FILE/nitens/Contraction/KEGG_enrichment_nitens_Contraction_cafe.csv
    Modified:   data/cafe5_results/Base_change_FILE/nitens/Contraction/enrich_KEGG_nitens_Contraction_cafe.txt
    Modified:   data/cafe5_results/Base_change_FILE/nitens/Expansion/GO_BP_dotplot_nitens_Expansion_cafe.pdf
    Modified:   data/cafe5_results/Base_change_FILE/nitens/Expansion/GO_CC_dotplot_nitens_Expansion_cafe.pdf
    Modified:   data/cafe5_results/Base_change_FILE/nitens/Expansion/GO_MF_dotplot_nitens_Expansion_cafe.pdf
    Modified:   data/cafe5_results/Base_change_FILE/nitens/Expansion/KEGG_dotplot_nitens_Expansion_cafe.pdf
    Modified:   data/cafe5_results/Base_change_FILE/nitens/Expansion/KEGG_enrichment_nitens_Expansion_cafe.csv
    Modified:   data/cafe5_results/Base_change_FILE/nitens/Expansion/enrich_KEGG_nitens_Expansion_cafe.txt
    Modified:   data/cafe5_results/Base_change_FILE/piceifrons/Contraction/GO_BP_dotplot_piceifrons_Contraction_cafe.pdf
    Modified:   data/cafe5_results/Base_change_FILE/piceifrons/Contraction/GO_CC_dotplot_piceifrons_Contraction_cafe.pdf
    Modified:   data/cafe5_results/Base_change_FILE/piceifrons/Contraction/GO_MF_dotplot_piceifrons_Contraction_cafe.pdf
    Modified:   data/cafe5_results/Base_change_FILE/piceifrons/Contraction/KEGG_dotplot_piceifrons_Contraction_cafe.pdf
    Modified:   data/cafe5_results/Base_change_FILE/piceifrons/Contraction/KEGG_enrichment_piceifrons_Contraction_cafe.csv
    Modified:   data/cafe5_results/Base_change_FILE/piceifrons/Contraction/enrich_KEGG_piceifrons_Contraction_cafe.txt
    Modified:   data/cafe5_results/Base_change_FILE/piceifrons/Expansion/GO_BP_dotplot_piceifrons_Expansion_cafe.pdf
    Modified:   data/cafe5_results/Base_change_FILE/piceifrons/Expansion/GO_CC_dotplot_piceifrons_Expansion_cafe.pdf
    Modified:   data/cafe5_results/Base_change_FILE/piceifrons/Expansion/GO_MF_dotplot_piceifrons_Expansion_cafe.pdf
    Modified:   data/cafe5_results/Base_change_FILE/piceifrons/Expansion/KEGG_dotplot_piceifrons_Expansion_cafe.pdf
    Modified:   data/cafe5_results/Base_change_FILE/piceifrons/Expansion/KEGG_enrichment_piceifrons_Expansion_cafe.csv
    Modified:   data/cafe5_results/Base_change_FILE/piceifrons/Expansion/enrich_KEGG_piceifrons_Expansion_cafe.txt
    Modified:   data/cafe5_results/Gene_count_FILE/GO_BP_heatmap_top15.pdf
    Modified:   data/cafe5_results/Gene_count_FILE/GO_CC_heatmap_top15.pdf
    Modified:   data/cafe5_results/Gene_count_FILE/GO_MF_heatmap_top15.pdf
    Modified:   data/cafe5_results/Gene_count_FILE/KEGG_subcategory_faceted_heatmap_Count.pdf
    Modified:   data/cafe5_results/Gene_count_FILE/americana/GO_BP_dotplot_americana_cafe.pdf
    Modified:   data/cafe5_results/Gene_count_FILE/americana/GO_CC_dotplot_americana_cafe.pdf
    Modified:   data/cafe5_results/Gene_count_FILE/americana/GO_MF_dotplot_americana_cafe.pdf
    Modified:   data/cafe5_results/Gene_count_FILE/americana/KEGG_dotplot_americana_cafe.pdf
    Modified:   data/cafe5_results/Gene_count_FILE/americana/KEGG_enrichment_americana_cafe.csv
    Modified:   data/cafe5_results/Gene_count_FILE/americana/enrich_KEGG_americana_cafe.txt
    Modified:   data/cafe5_results/Gene_count_FILE/cancellata/GO_BP_dotplot_cancellata_cafe.pdf
    Modified:   data/cafe5_results/Gene_count_FILE/cancellata/GO_CC_dotplot_cancellata_cafe.pdf
    Modified:   data/cafe5_results/Gene_count_FILE/cancellata/GO_MF_dotplot_cancellata_cafe.pdf
    Modified:   data/cafe5_results/Gene_count_FILE/cancellata/KEGG_dotplot_cancellata_cafe.pdf
    Modified:   data/cafe5_results/Gene_count_FILE/cancellata/KEGG_enrichment_cancellata_cafe.csv
    Modified:   data/cafe5_results/Gene_count_FILE/cancellata/enrich_KEGG_cancellata_cafe.txt
    Modified:   data/cafe5_results/Gene_count_FILE/cubense/GO_BP_dotplot_cubense_cafe.pdf
    Modified:   data/cafe5_results/Gene_count_FILE/cubense/GO_CC_dotplot_cubense_cafe.pdf
    Modified:   data/cafe5_results/Gene_count_FILE/cubense/GO_MF_dotplot_cubense_cafe.pdf
    Modified:   data/cafe5_results/Gene_count_FILE/cubense/KEGG_dotplot_cubense_cafe.pdf
    Modified:   data/cafe5_results/Gene_count_FILE/cubense/KEGG_enrichment_cubense_cafe.csv
    Modified:   data/cafe5_results/Gene_count_FILE/cubense/enrich_KEGG_cubense_cafe.txt
    Modified:   data/cafe5_results/Gene_count_FILE/gregaria/GO_BP_dotplot_gregaria_cafe.pdf
    Modified:   data/cafe5_results/Gene_count_FILE/gregaria/GO_CC_dotplot_gregaria_cafe.pdf
    Modified:   data/cafe5_results/Gene_count_FILE/gregaria/GO_MF_dotplot_gregaria_cafe.pdf
    Modified:   data/cafe5_results/Gene_count_FILE/gregaria/KEGG_dotplot_gregaria_cafe.pdf
    Modified:   data/cafe5_results/Gene_count_FILE/gregaria/KEGG_enrichment_gregaria_cafe.csv
    Modified:   data/cafe5_results/Gene_count_FILE/gregaria/enrich_KEGG_gregaria_cafe.txt
    Modified:   data/cafe5_results/Gene_count_FILE/locusta/GO_BP_dotplot_locusta_cafe.pdf
    Modified:   data/cafe5_results/Gene_count_FILE/locusta/GO_CC_dotplot_locusta_cafe.pdf
    Modified:   data/cafe5_results/Gene_count_FILE/locusta/GO_MF_dotplot_locusta_cafe.pdf
    Modified:   data/cafe5_results/Gene_count_FILE/locusta/KEGG_dotplot_locusta_cafe.pdf
    Modified:   data/cafe5_results/Gene_count_FILE/locusta/KEGG_enrichment_locusta_cafe.csv
    Modified:   data/cafe5_results/Gene_count_FILE/locusta/enrich_KEGG_locusta_cafe.txt
    Modified:   data/cafe5_results/Gene_count_FILE/nitens/GO_BP_dotplot_nitens_cafe.pdf
    Modified:   data/cafe5_results/Gene_count_FILE/nitens/GO_CC_dotplot_nitens_cafe.pdf
    Modified:   data/cafe5_results/Gene_count_FILE/nitens/GO_MF_dotplot_nitens_cafe.pdf
    Modified:   data/cafe5_results/Gene_count_FILE/nitens/KEGG_dotplot_nitens_cafe.pdf
    Modified:   data/cafe5_results/Gene_count_FILE/nitens/KEGG_enrichment_nitens_cafe.csv
    Modified:   data/cafe5_results/Gene_count_FILE/nitens/enrich_KEGG_nitens_cafe.txt
    Modified:   data/cafe5_results/Gene_count_FILE/piceifrons/GO_BP_dotplot_piceifrons_cafe.pdf
    Modified:   data/cafe5_results/Gene_count_FILE/piceifrons/GO_CC_dotplot_piceifrons_cafe.pdf
    Modified:   data/cafe5_results/Gene_count_FILE/piceifrons/GO_MF_dotplot_piceifrons_cafe.pdf
    Modified:   data/cafe5_results/Gene_count_FILE/piceifrons/KEGG_dotplot_piceifrons_cafe.pdf
    Modified:   data/cafe5_results/Gene_count_FILE/piceifrons/KEGG_enrichment_piceifrons_cafe.csv
    Modified:   data/cafe5_results/Gene_count_FILE/piceifrons/enrich_KEGG_piceifrons_cafe.txt
Note that any generated files, e.g. HTML, png, CSS, etc., are not included in this status report because it is ok for generated content to have uncommitted changes.
These are the previous versions of the repository in which changes were
made to the R Markdown (analysis/2_gene-family.Rmd) and
HTML (docs/2_gene-family.html) files. If you’ve configured
a remote Git repository (see ?wflow_git_remote), click on
the hyperlinks in the table below to view the files as they were in that
past version.
| File | Version | Author | Date | Message |
|---|---|---|---|---|
| html | 7744eb3 | Maeva TECHER | 2026-04-06 | Build site. |
| html | b332e25 | Maeva TECHER | 2026-04-06 | Build site. |
| Rmd | 84f6e1f | Maeva TECHER | 2026-04-06 | workflowr::wflow_publish("analysis/2_gene-family.Rmd") |
| html | de68246 | Maeva TECHER | 2026-03-02 | Build site. |
| Rmd | d1b8eb8 | Maeva TECHER | 2025-09-17 | added last analyses |
| html | d1b8eb8 | Maeva TECHER | 2025-09-17 | added last analyses |
| html | 36f043d | Maeva TECHER | 2025-06-05 | Build site. |
| Rmd | 4e391c3 | Maeva TECHER | 2025-05-30 | add new analysis orthology, synteny |
| html | 4e391c3 | Maeva TECHER | 2025-05-30 | add new analysis orthology, synteny |
| Rmd | b982319 | Maeva TECHER | 2025-03-03 | update font |
| html | b982319 | Maeva TECHER | 2025-03-03 | update font |
| html | 84bca53 | Maeva TECHER | 2025-02-27 | Build site. |
| html | d0b7267 | Maeva TECHER | 2025-02-27 | Build site. |
| Rmd | faf2db3 | Maeva TECHER | 2025-01-13 | update markdown |
| html | faf2db3 | Maeva TECHER | 2025-01-13 | update markdown |
| html | 3fa8e62 | Maeva TECHER | 2024-11-09 | updated analysis |
| html | edb70fe | Maeva TECHER | 2024-11-08 | overlap and deg results created |
| html | ba35b82 | Maeva A. TECHER | 2024-06-20 | Build site. |
| html | bf74631 | Maeva A. TECHER | 2024-05-14 | Build site. |
| Rmd | 41bd625 | Maeva A. TECHER | 2024-05-14 | wflow_publish("analysis/2_gene-family.Rmd") |
| html | 0837617 | Maeva A. TECHER | 2024-01-30 | Build site. |
| html | f701a01 | Maeva A. TECHER | 2024-01-30 | reupdate |
| html | 7b901bb | Maeva A. TECHER | 2024-01-24 | Build site. |
| html | 8c22d7c | Maeva A. TECHER | 2024-01-24 | Build site. |
| html | 1b09cbe | Maeva A. TECHER | 2024-01-24 | remove |
| html | deba29e | Maeva A. TECHER | 2023-12-18 | Build site. |
| Rmd | 53877fa | Maeva A. TECHER | 2023-12-18 | add pages |
Running CAFE on OrthoFinder output
We will be analyzing the gene family expansion and contraction using
CAFE5
developed by the Hahn lab. We can use the output files generated by
OrthoFinder after a quick manipulation to format the input
needed to estimate the gene gain and loss. CAFE5 requires two input: -
Input 1: The number of genes per species in each gene family (here
orthogroup). - Input 2: An ultrametric time tree with the same species
name.
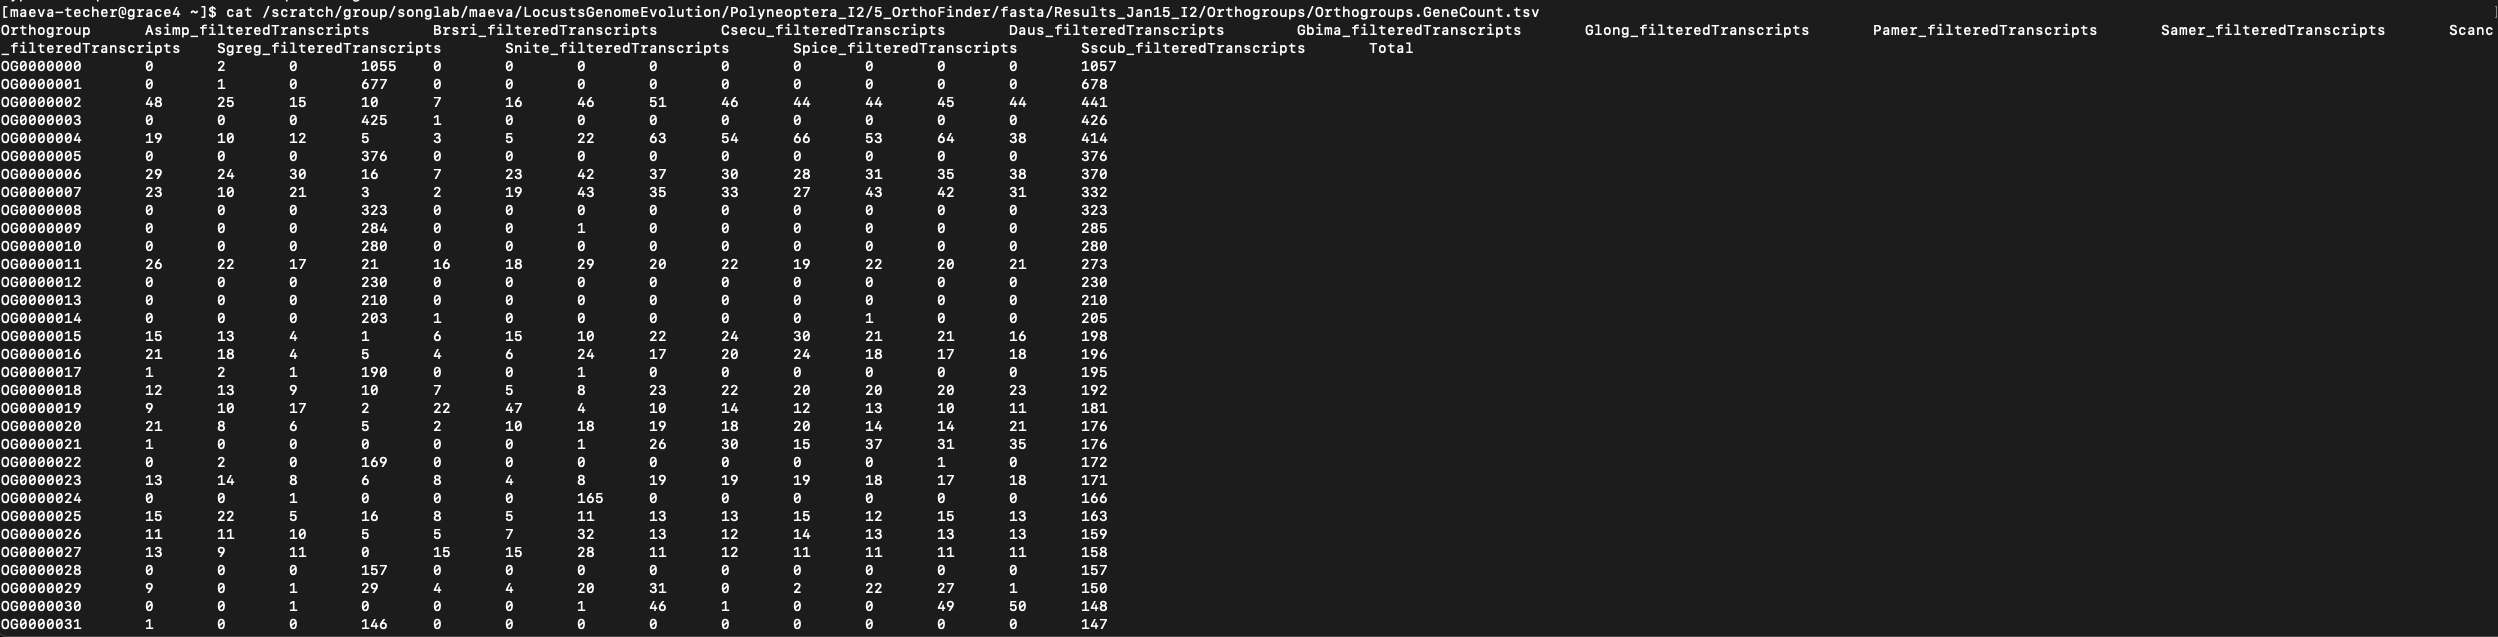
1. Formatting the Gene Count Matrix
For input 1, we will be using the GeneCount matrix generated by
OrthoFinder2 which is located in the
Results_DATE/Orthogroups output folder. The file of
interest is the Orthogroups.GeneCount.tsv matrix which is
formatted as shown below:
However, whether it is the Polyneoptera run (13 species) or Schistocerca only (6 species), we encounter an issue for downstream analysis as some orthogroups have too many genes or a too high size variation which can cause difficulty for model convergence. We found a large number of duplication events in several orthogroups which can bias the overal picture. We will then apply some filtering rules:
For Polyneoptera - We remove all orthogroups with > 400 genes - We remove all orthogroups with > 100 size variation
For Schistocerca - We remove all orthogroups with > X genes - We remove all orthogroups with > X size variation
We can do it manually or use the following script
python 1_filter_large_variation_OGs.py:
srun --ntasks 1 --cpus-per-task 8 --mem 50G --time 03:00:00 --pty bash

ml GCCcore/14.2.0 Python/3.13.1
#python -m venv --system-site-packages ./venv
#source ./venv/bin/activate
#pip install --upgrade pip
#pip install pandas

import pandas as pd

# Input/Output file paths
input_file = "Orthogroups.GeneCount.tsv"
output_file = "Orthogroups_drop4CAFE.tsv"

# Read TSV (tab-separated)
df = pd.read_csv(input_file, sep="\t")

# Drop orthogroups with more than 450 genes in total
df_filtered = df[df.iloc[:, 1:].sum(axis=1) <= 200] # For Schistocerca
#df_filtered = df[df.iloc[:, 1:].sum(axis=1) <= 300] # For Polyneoptera

# Drop orthogroups where the max difference across species is >100
df_filtered = df_filtered[df_filtered.iloc[:, 1:].max(axis=1) - df_filtered.iloc[:, 1:].min(axis=1) <= 50] # For Schistocerca
#df_filtered = df_filtered[df_filtered.iloc[:, 1:].max(axis=1) - df_filtered.iloc[:, 1:].min(axis=1) <= 100] # For Polyneoptera

# Write the filtered table to a TSV file
df_filtered.to_csv(output_file, sep="\t", index=False)
print(f"Filtered orthogroups written to: {output_file}")
Then we need to format the file more by removing the
Total column, adding a column Description with
values = null.
# Step 1: Add "(null)" as the first column
awk -F'\t' '{print "(null)\t"$0}' Orthogroups_drop4CAFE.tsv > tmp.tsv

# Step 2: Rename the first header column to "Desc"
sed -i '1s/^(null)/Desc/' tmp.tsv

# Step 3: Remove the last column (Total), even if column numbers vary
awk -F'\t' '{$NF=""; print $0}' tmp.tsv | rev | sed 's/^\s*//g' | rev | tr ' ' '\t' > Orthogroups_readytoCAFE.tsv

# Optional: remove intermediate file
rm tmp.tsv

# We clean the species name so it is easier for plotting later
sed '1s/_filteredTranscripts//g' Orthogroups_readytoCAFE.tsv > Orthogroups_readytoCAFE_cleaned.tsv
2. Formatting the Species Tree
For input 2, we will copy the tree file generated by
OrthoFinder unless we specify our own calibrated tree. We
will take SpeciesTree_rooted.txt from the
Results_DATE/SpeciesTree output folder.
If we modify the header (names of species) of the GeneCount file,
this must be reflected in the species tree file as well. For CAFE, the
tree must be ultrametric in the past I used directly the script make_ultrametric.py
available from Orthofinder:
# Orthofinder needs to be loaded for it
# On Grace we may have to create a virtual environment if numpy is not installed
# python -m venv --system-site-packages ./venv
# source venv/bin/activate
# pip install numpy

#ml GCC/12.3.0  OpenMPI/4.1.5 OrthoFinder/2.5.5
#python ./make_ultrametric.py SpeciesTree_rooted.txt
However, I noticed that the tree does not rescale always properly and
also if the branches are too short like for Schistocerca,
CAFE will throw the inf error as the model can
not converge as there is not enough time for gene family evolution. So
now, as we do not have a calibrated tree, I rescale the topology of the
tree (which was run with bootstraps) with a factor of 10 and make
ultrametric in R:
ml GCC/13.2.0  OpenMPI/4.1.6 R_tamu/4.4.1
export R_LIBS=$SCRATCH/R_LIBS_USER/
We then launch R:
library(ape)

# Set your input/output
input_tree <- "SpeciesTree_rooted.txt"
output_tree <- "rescaled_ultrametric_SpeciesTree.txt"

# Read the tree
tree <- read.tree(input_tree)

# Force ultrametric (can adjust lambda or try other methods if needed)
ultra_tree <- chronos(tree, lambda = 1)

# Optional: check it worked
stopifnot(is.ultrametric(ultra_tree))

# 🔁 RESCALE: Multiply all branch lengths by a factor (e.g., ×100)
scaling_factor <- 10
ultra_tree$edge.length <- ultra_tree$edge.length * scaling_factor

# Write the rescaled ultrametric tree
write.tree(ultra_tree, file = output_tree)

cat("✅ Tree written to:", output_tree, "\n")
As we did earlier for the Orthogroups file, we want to clean the name so it is easier for plotting later:
sed 's/_filteredTranscripts//g' rescaled_ultrametric_SpeciesTree.txt > rescaled_ultrametric_SpeciesTree_cleaned.txt3. Running CAFE5
module purge
ml GCC/12.2.0 CAFE5/5.0.0

cafe5 -t rescaled_ultrametric_SpeciesTree_cleaned.txt -i Orthogroups_readytoCAFE_cleaned.tsv
When successful we can look at the results folder and
extract the results from Base_clade_results
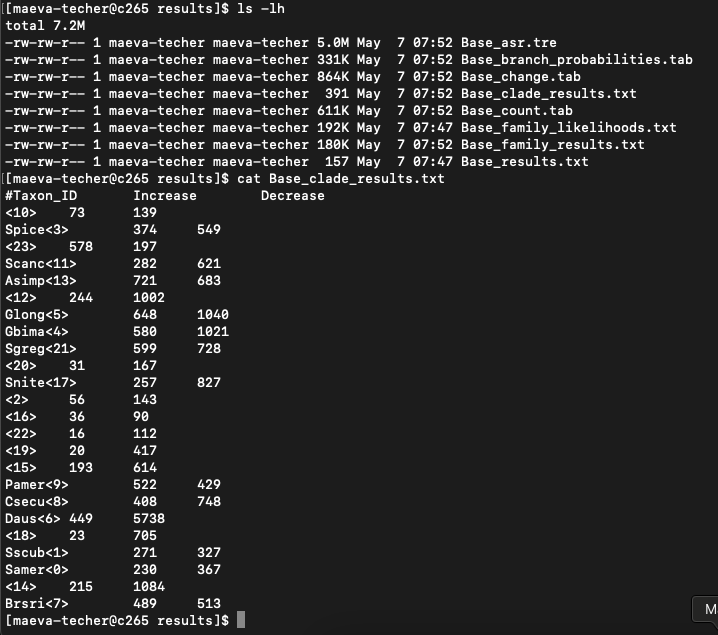
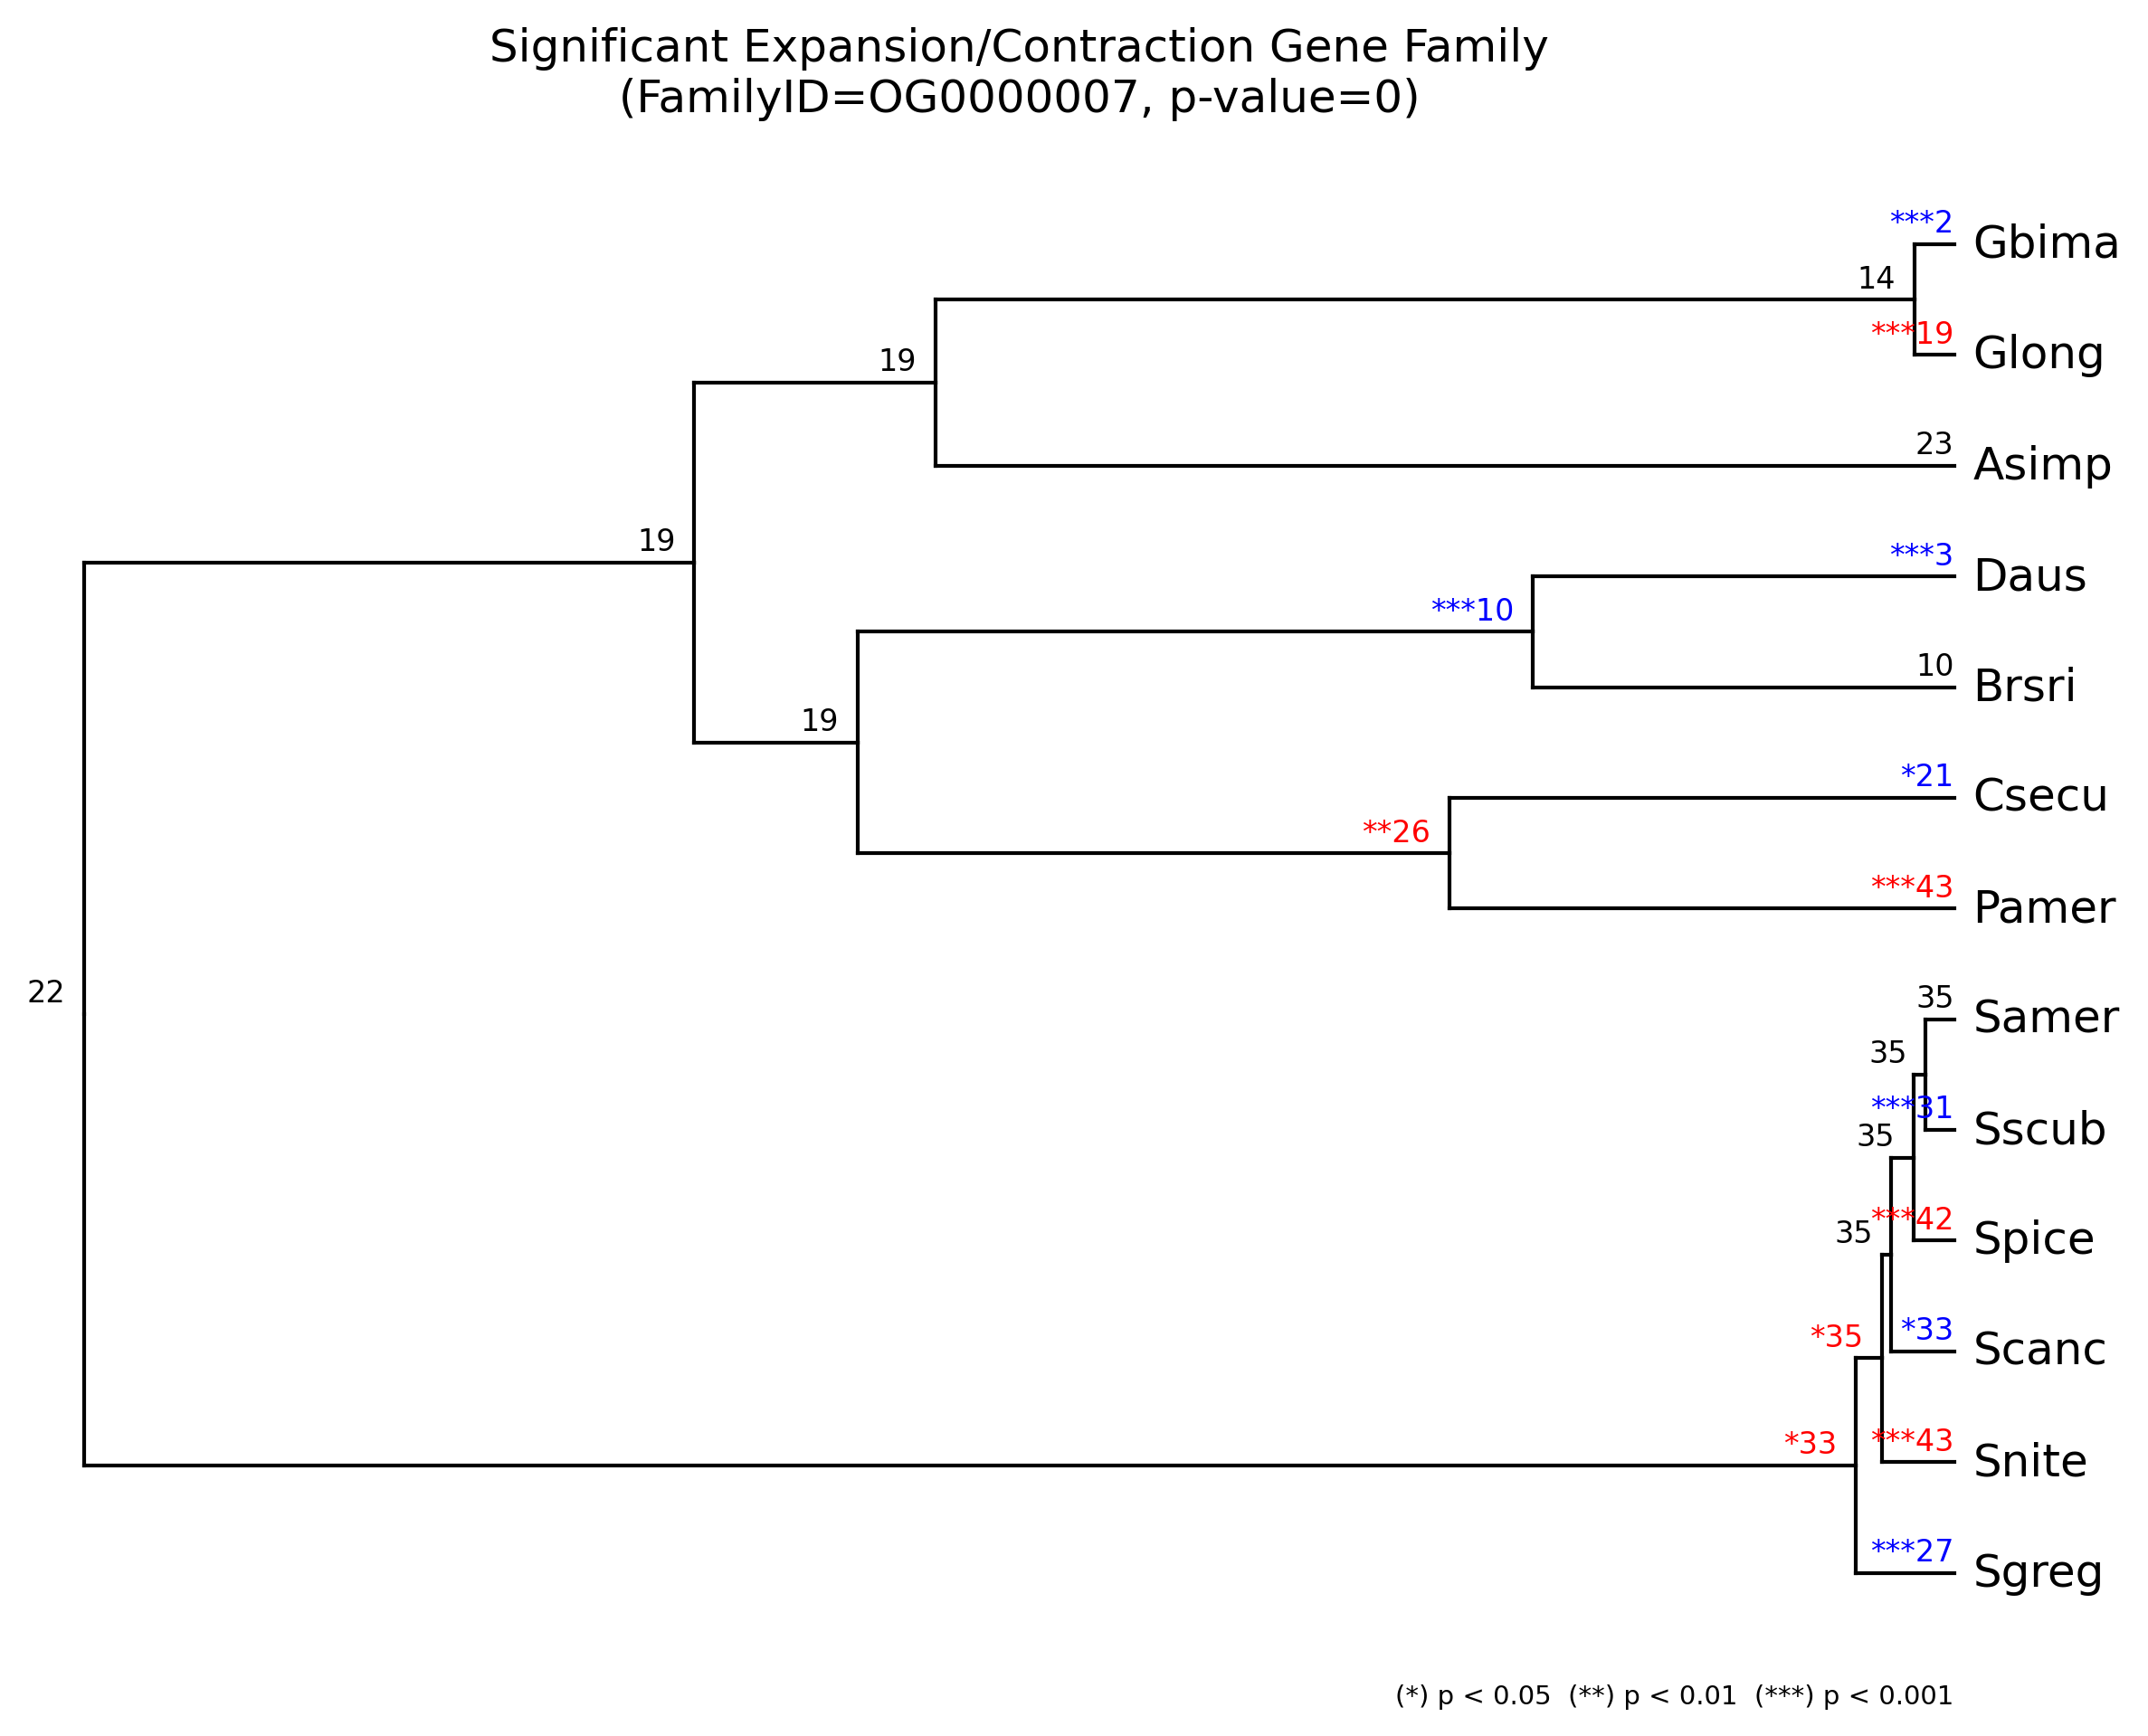
4. Plot results
We can plot the results for all families and for each gene family by
using cafeplotter.
For that we run the following commands and output examples are shown below:
source /venv/bin/activate
# pip install cafeplotter

cafeplotter -i results -o plots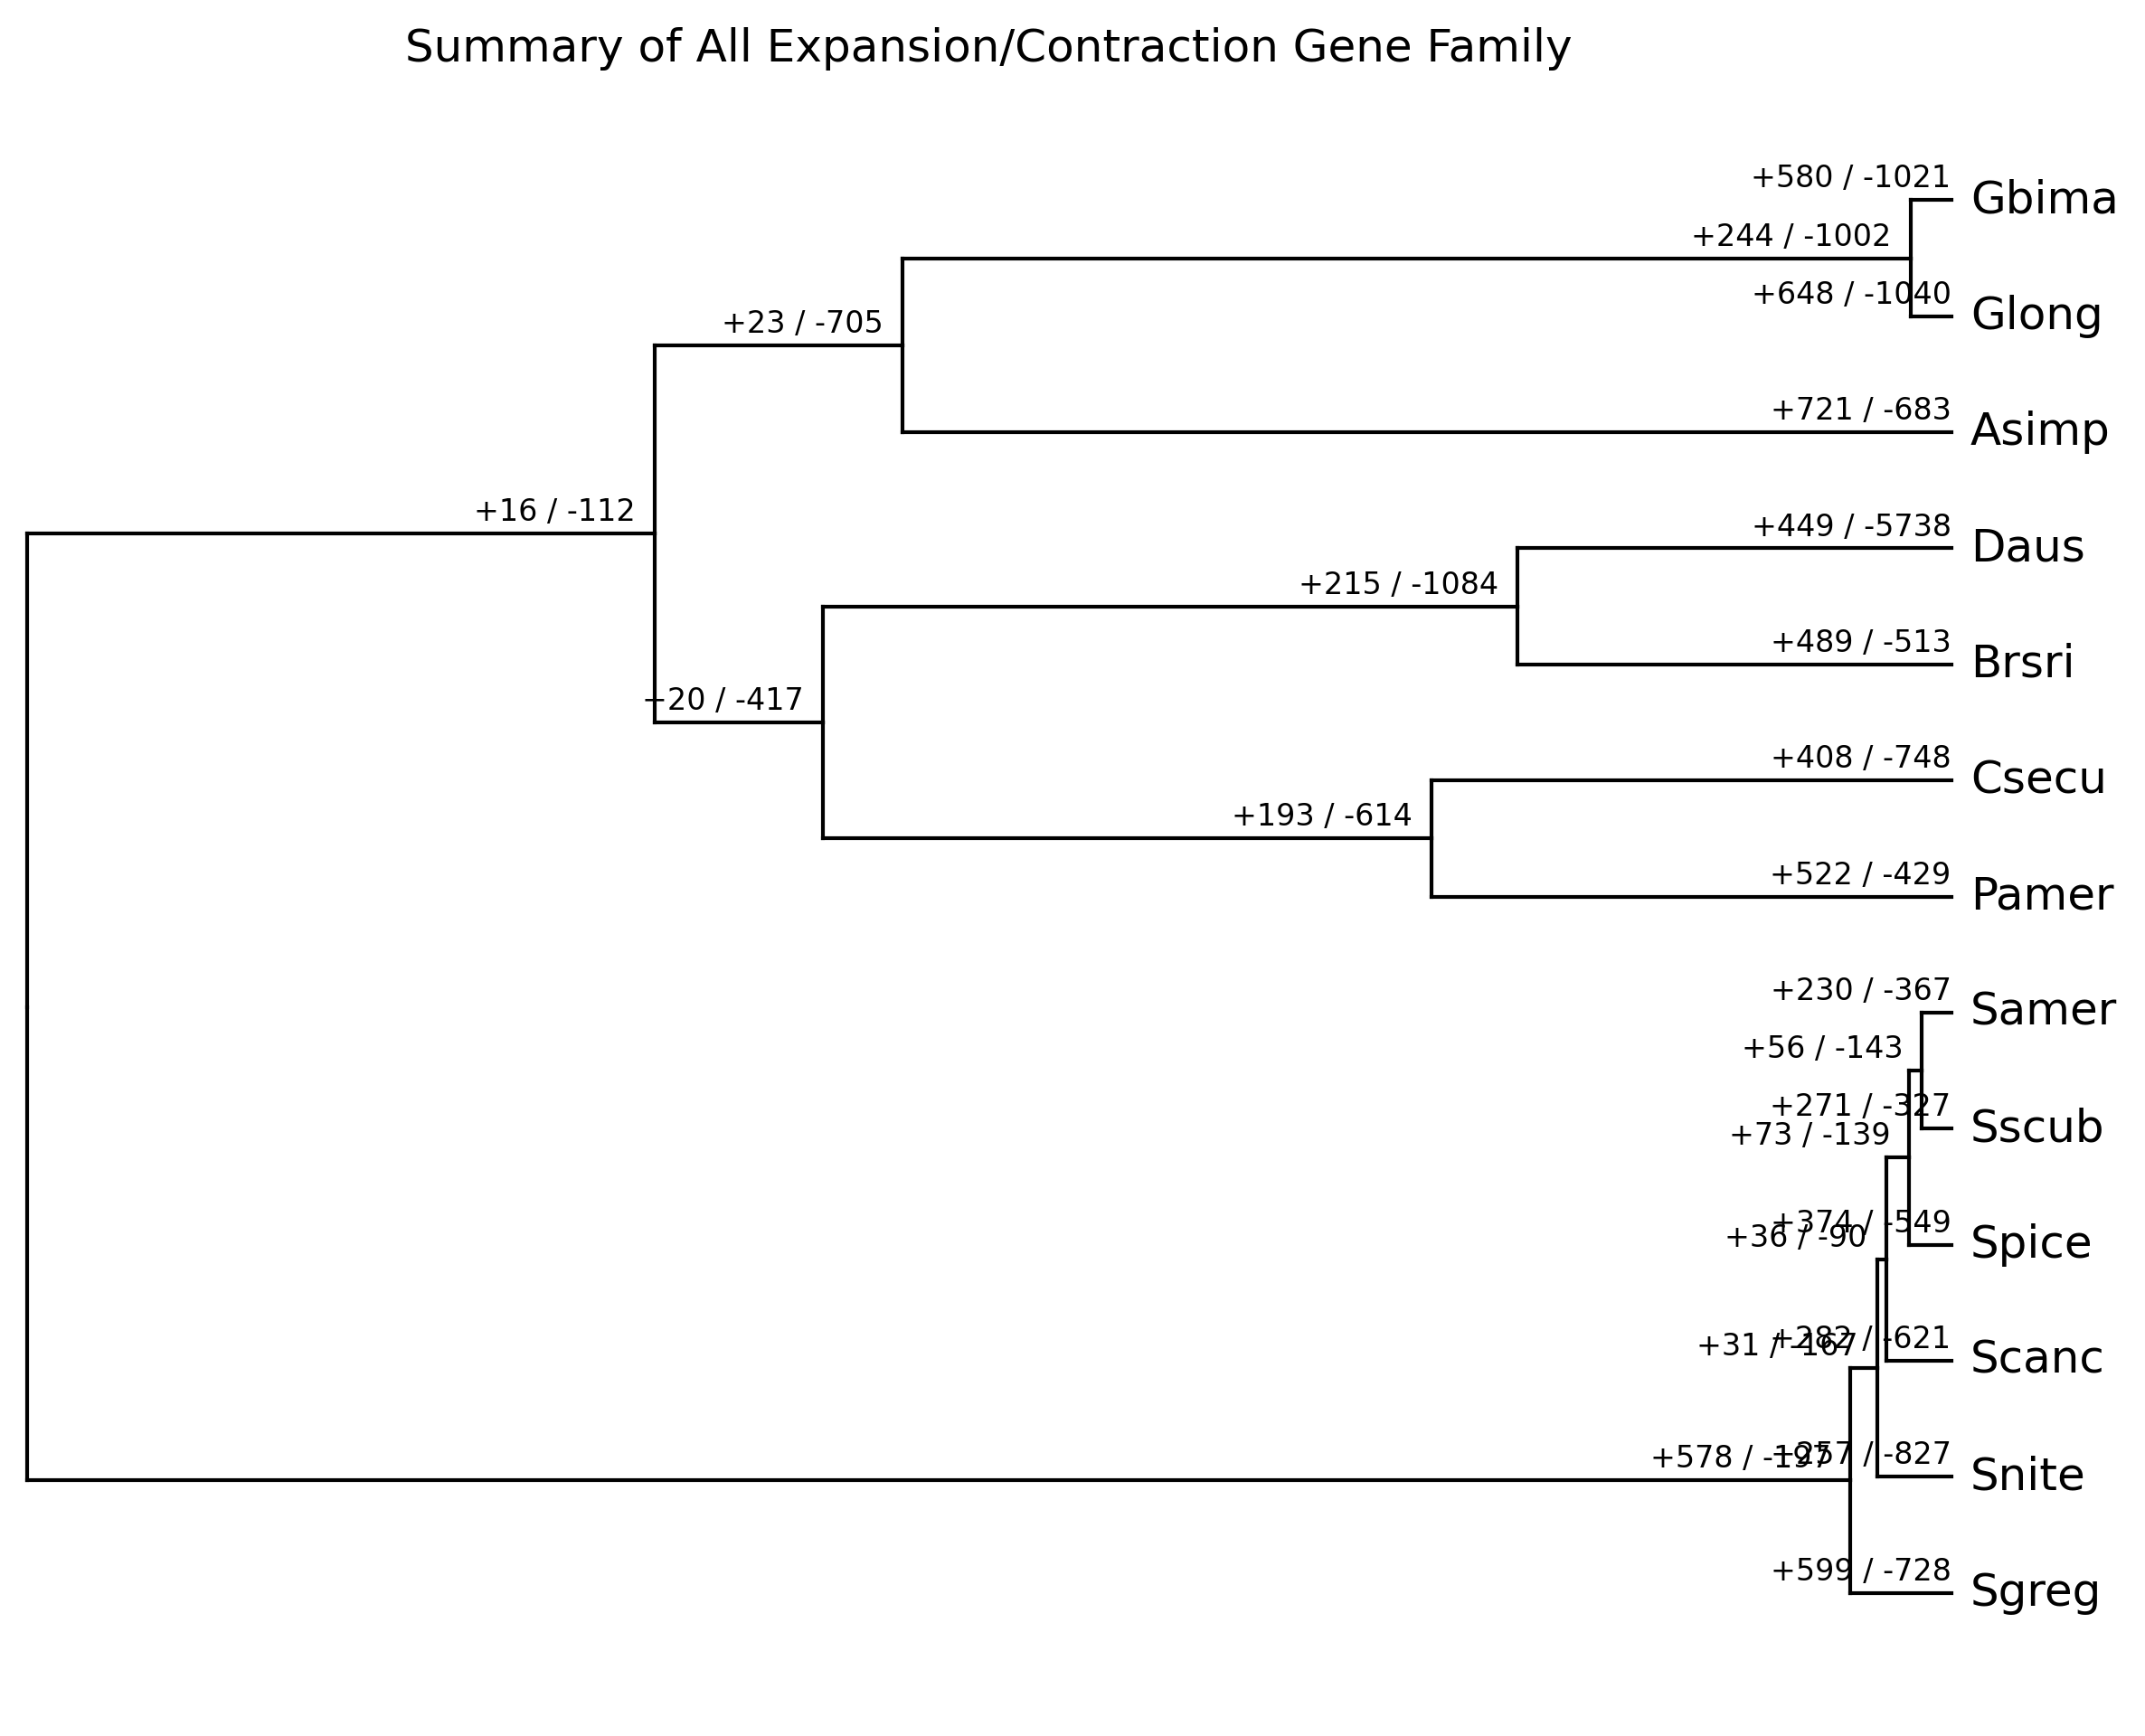
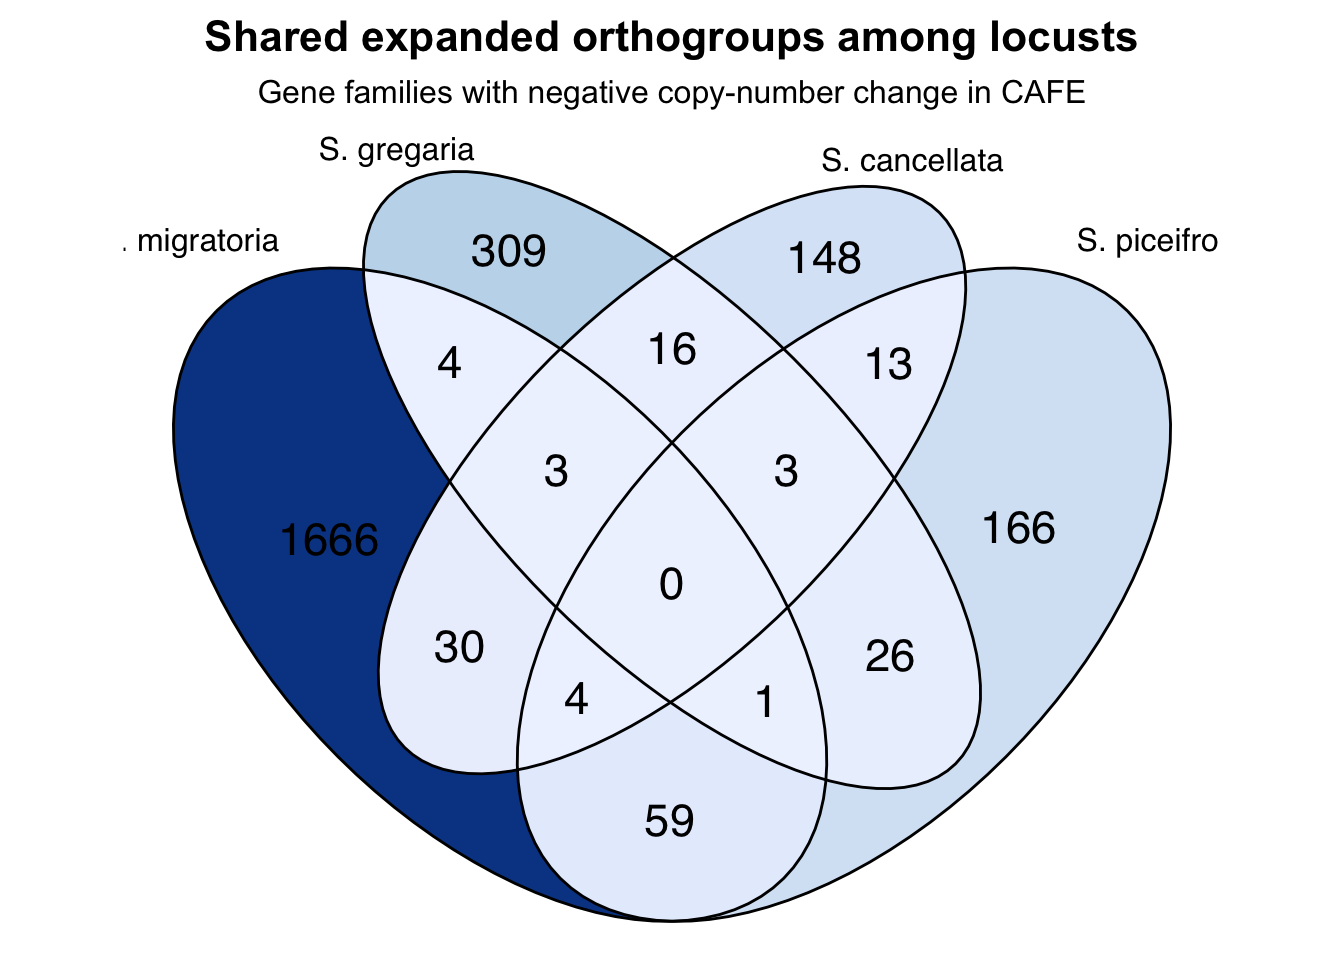
5. Overlap
Expansion
library(dplyr)
Attaching package: 'dplyr'The following objects are masked from 'package:stats':
filter, lagThe following objects are masked from 'package:base':
intersect, setdiff, setequal, unionlibrary(tidyr)Warning: package 'tidyr' was built under R version 4.4.3library(readr)Warning: package 'readr' was built under R version 4.4.3library(ggplot2)Warning: package 'ggplot2' was built under R version 4.4.3library(ggVennDiagram)Warning: package 'ggVennDiagram' was built under R version 4.4.3
Attaching package: 'ggVennDiagram'The following object is masked from 'package:tidyr':
unitebase_change <- read.delim(
"/Users/maevatecher/Documents/GitHub/locust-comparative-genomics/data/cafe5_results/Results_26May_iqtree/Base_change.tab",
sep = "\t",
header = TRUE
)
# Remove junk columns and clean names
base_change <- base_change %>%
select(-matches("^X"))
colnames(base_change) <- sub("\\..*", "", colnames(base_change))
colnames(base_change)[1] <- "Orthogroup"
gene_counts <- read.delim(
"/Users/maevatecher/Documents/GitHub/locust-comparative-genomics/data/orthofinder/Polyneoptera/Results_I2_iqtree/Orthogroups/Orthogroups.GeneCount.tsv",
sep = "\t",
header = TRUE
)
colnames(gene_counts)[1] <- "Orthogroup"
species_cols <- c(
Lmigr = "Lmigr_filteredTranscripts",
Sgreg = "Sgreg_filteredTranscripts",
Scanc = "Scanc_filteredTranscripts",
Spice = "Spice_filteredTranscripts"
)
locust_species <- c("Lmigr", "Sgreg", "Scanc", "Spice")
venn_list_expanded <- lapply(names(species_cols), function(sp) {
sp_col <- species_cols[[sp]]
expanded_ogs <- base_change %>%
filter(.data[[sp]] > 0) %>%
pull(Orthogroup)
gene_counts %>%
filter(
Orthogroup %in% expanded_ogs,
.data[[sp_col]] >= 0
) %>%
pull(Orthogroup) %>%
unique()
})
names(venn_list_expanded) <- names(species_cols)
library(ggVennDiagram)
library(ggplot2)
venn_list_expanded_pretty <- venn_list_expanded
names(venn_list_expanded_pretty) <- c(
"L. migratoria",
"S. gregaria",
"S. cancellata",
"S. piceifrons"
)
p <- ggVennDiagram(
venn_list_expanded_pretty,
label = "count",
label_alpha = 0,
label_size = 6,
edge_size = 0.5
)
p + scale_fill_distiller(palette = "Blues", direction = 0)+
labs(
title = "Shared expanded orthogroups among locusts",
subtitle = "Gene families with negative copy-number change in CAFE"
) +
theme_void(base_size = 15) +
theme(
plot.title = element_text(face = "bold", size = 16, hjust = 0.5),
plot.subtitle = element_text(size = 12, hjust = 0.5),
legend.position = "none"
)
| Version | Author | Date |
|---|---|---|
| b332e25 | Maeva TECHER | 2026-04-06 |
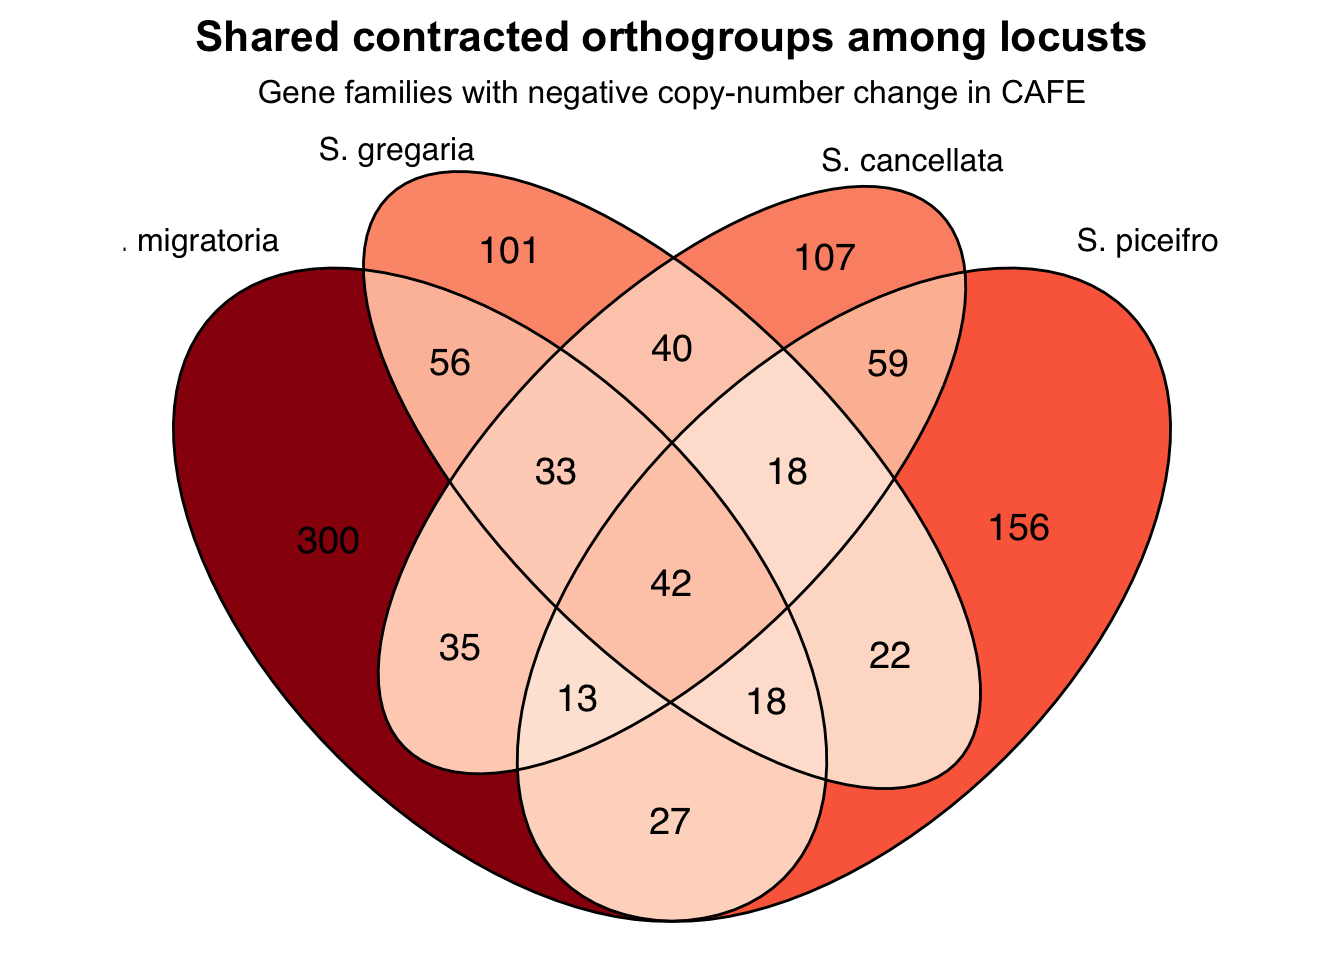
Contraction
library(dplyr)
library(tidyr)
library(readr)
library(ggVennDiagram)

base_change <- read.delim(
  "/Users/maevatecher/Documents/GitHub/locust-comparative-genomics/data/cafe5_results/Results_26May_iqtree/Base_change.tab",
  sep = "\t",
  header = TRUE
)

# Remove junk columns and clean names
base_change <- base_change %>%
  select(-matches("^X"))

colnames(base_change) <- sub("\\..*", "", colnames(base_change))
colnames(base_change)[1] <- "Orthogroup"

gene_counts <- read.delim(
  "/Users/maevatecher/Documents/GitHub/locust-comparative-genomics/data/orthofinder/Polyneoptera/Results_I2_iqtree/Orthogroups/Orthogroups.GeneCount.tsv",
  sep = "\t",
  header = TRUE
)

colnames(gene_counts)[1] <- "Orthogroup"

species_cols <- c(
  Lmigr = "Lmigr_filteredTranscripts",
  Sgreg = "Sgreg_filteredTranscripts",
  Scanc = "Scanc_filteredTranscripts",
  Spice = "Spice_filteredTranscripts"
)

venn_list_contracted <- lapply(names(species_cols), function(sp) {
  base_change %>%
    filter(.data[[sp]] < 0) %>%
    pull(Orthogroup) %>%
    unique()
})

names(venn_list_contracted) <- names(species_cols)


library(ggVennDiagram)
library(ggplot2)

venn_list_contracted_pretty <- venn_list_contracted
names(venn_list_contracted_pretty) <- c(
  "L. migratoria",
  "S. gregaria",
  "S. cancellata",
  "S. piceifrons"
)

p <- ggVennDiagram(
  venn_list_contracted_pretty,
  label = "count",
  label_alpha = 0,
  label_size = 5,
  edge_size = 0.5
)

p + scale_fill_distiller(palette = "Reds", direction = 0)+
  labs(
    title = "Shared contracted orthogroups among locusts",
    subtitle = "Gene families with negative copy-number change in CAFE"
  ) +
  theme_void(base_size = 15) +
  theme(
    plot.title = element_text(face = "bold", size = 16, hjust = 0.5),
    plot.subtitle = element_text(size = 12, hjust = 0.5),
    legend.position = "none"
  )
| Version | Author | Date |
|---|---|---|
| b332e25 | Maeva TECHER | 2026-04-06 |
Table
# Expanded shared across all locusts
shared_expanded <- Reduce(intersect, venn_list_expanded)

# Contracted shared across all locusts
shared_contracted <- Reduce(intersect, venn_list_contracted)

length(shared_expanded)
[1] 0length(shared_contracted)[1] 42library(dplyr)
overlap_og_table <- bind_rows(
tibble(Orthogroup = shared_expanded, Change = "Expansion"),
tibble(Orthogroup = shared_contracted, Change = "Contraction")
)
print(overlap_og_table)# A tibble: 42 × 2
Orthogroup Change
<chr> <chr>
1 OG0000670 Contraction
2 OG0001436 Contraction
3 OG0001840 Contraction
4 OG0004881 Contraction
5 OG0005605 Contraction
6 OG0007860 Contraction
7 OG0009053 Contraction
8 OG0009834 Contraction
9 OG0009871 Contraction
10 OG0010145 Contraction
# ℹ 32 more rows# Load annotation if not already done
ortho_map <- read.csv(
"/Users/maevatecher/Documents/GitHub/locust-comparative-genomics/data/orthofinder/Polyneoptera/Results_I2_iqtree/Orthogroups_genesproteinbiotype_13species_annotated_May2025.csv",
header = TRUE,
stringsAsFactors = FALSE
)
library(dplyr)
library(knitr)Warning: package 'knitr' was built under R version 4.4.3library(kableExtra)
Attaching package: 'kableExtra'The following object is masked from 'package:dplyr':
group_rows# keep only the locust species in the annotation file
locust_species_map <- c("Lmigr", "Sgreg", "Scanc", "Spice")
overlap_annotated <- overlap_og_table %>%
left_join(ortho_map, by = "Orthogroup") %>%
filter(Species %in% locust_species_map)
# summarize to one row per orthogroup
overlap_summary <- overlap_annotated %>%
group_by(Orthogroup, Change) %>%
summarise(
Species_present = paste(sort(unique(Species)), collapse = ", "),
Example_genes = paste(unique(GeneID)[1:min(6, n_distinct(GeneID))], collapse = ", "),
Example_description = paste(unique(na.omit(Description))[1:min(3, sum(!is.na(Description)))], collapse = " | "),
.groups = "drop"
) %>%
arrange(Change, Orthogroup)
overlap_summary %>%
kable(
caption = "Orthogroups shared across all locusts with common copy-number change",
align = c("l", "l", "l", "l", "l")
) %>%
kable_styling(
bootstrap_options = c("striped", "hover", "condensed"),
full_width = FALSE
) %>%
scroll_box(width = "100%", height = "500px")| Orthogroup | Change | Species_present | Example_genes | Example_description |
|---|---|---|---|---|
| NA | NA | NA | NA | NA |
| :———- | :—— | :————— | :————- | :——————- |
6. KEGG pathways
We are interested in knowing the function of the gene family expansion per species. First we need to extract the list of genes expanding for each species. We are working on two different files.
The first file will be looking at each gene family that expanded and
those who contracted using the Base_change.tab from CAFE5
which shows the increase and decrease for each node of the tree for each
species.
The second file will be the actual gene counts that was used as input
Orthogroups.GeneCount.tsv and we will look only at families
with at least 10 copies per species.
Base change gain
Step 1
library(dplyr)
library(tidyr)
library(readr)
library(purrr)

# Load files
base_change <- read.delim("/Users/maevatecher/Documents/GitHub/locust-comparative-genomics/data/cafe5_results/Results_26May_iqtree/Base_change.tab", sep="\t", header=TRUE)

# Current names
names(base_change)
[1] "FamilyID" "Samer.0." "Sscub.1." "X.2." "Spice.3." "X.4."
[7] "Scanc.5." "X.6." "Snite.7." "Gbima.8." "Glong.9." "X.10."
[13] "Sgreg.11." "X.12." "Asimp.13." "Lmigr.14." "X.15." "X.16."
[19] "X.17." "Brsri.18." "X.19." "Csecu.20." "Pamer.21." "X.22."
[25] "X.23." "X.24." # Clean up: remove junk "X.*" columns
base_change <- base_change %>%
dplyr::select(-matches("^X")) # drop all columns starting with X
# Rename properly
colnames(base_change) <- sub("\\..*", "", colnames(base_change)) # keep only part before first dot
# make sure FamilyID column is consistently called Orthogroup
colnames(base_change)[1] <- "Orthogroup"
# Now FamilyID stays, and others become clean species codes
head(base_change) Orthogroup Samer Sscub Spice Scanc Snite Gbima Glong Sgreg Asimp Lmigr Brsri
1 OG0000002 -1 0 -1 2 0 -5 21 0 -4 -1 -2
2 OG0000004 0 -1 -1 0 -1 1 -4 0 1 1 2
3 OG0000005 1 0 0 0 -4 -6 2 1 10 -2 -4
4 OG0000006 0 0 0 -1 0 -4 0 0 0 1 -2
5 OG0000007 0 1 0 2 0 -2 0 6 7 -4 1
6 OG0000009 0 4 3 -1 -1 0 0 -1 0 0 1
Csecu Pamer
1 6 -7
2 -2 -2
3 -1 -1
4 -7 26
5 -6 7
6 0 0# -------------------------
# Load orthogroup map
# -------------------------
ortho_dir <- "/Users/maevatecher/Documents/GitHub/locust-comparative-genomics/data/orthofinder/Polyneoptera"
input_file <- file.path(ortho_dir, "Results_I2_iqtree/Orthogroups_genesproteinbiotype_13species_annotated_May2025.csv")
ortho_map <- read.csv(input_file, header = TRUE, stringsAsFactors = FALSE)
# -------------------------
# Species translation
# -------------------------
species_translate <- c(
Sgreg = "gregaria",
Scanc = "cancellata",
Spice = "piceifrons",
Samer = "americana",
Sscub = "cubense",
Snite = "nitens",
Lmigr = "locusta"
)
# -------------------------
# Build expanded_genes tibble
# -------------------------
# -------------------------
# Build expanded + contracted genes tibble
# -------------------------
cafe_genes <- map_dfr(names(species_translate), function(sp) {
message("Collecting OGs for ", sp)
# expansions (>0) and contractions (<0)
expanded_ogs <- base_change %>%
filter(!!sym(sp) > 0) %>%
mutate(ChangeType = "Expansion") %>%
pull(Orthogroup)
contracted_ogs <- base_change %>%
filter(!!sym(sp) < 0) %>%
mutate(ChangeType = "Contraction") %>%
pull(Orthogroup)
all_ogs <- tibble(
Orthogroup = c(expanded_ogs, contracted_ogs),
ChangeType = c(rep("Expansion", length(expanded_ogs)),
rep("Contraction", length(contracted_ogs)))
)
# If Lmigr -> reuse Sgreg’s genes
if (sp == "Lmigr") {
proxy_sp <- "Sgreg"
} else {
proxy_sp <- sp
}
ortho_map %>%
filter(Species == proxy_sp, Orthogroup %in% all_ogs$Orthogroup) %>%
left_join(all_ogs, by = "Orthogroup") %>%
mutate(Species = sp) %>%
dplyr::select(Species, Orthogroup, GeneID, ChangeType) %>%
distinct()
})
# Preview
head(cafe_genes) Species Orthogroup GeneID ChangeType
1 Sgreg OG0000005 LOC126281744 Expansion
2 Sgreg OG0000005 LOC126281746 Expansion
3 Sgreg OG0000005 LOC126282022 Expansion
4 Sgreg OG0000005 LOC126282417 Expansion
5 Sgreg OG0000005 LOC126335687 Expansion
6 Sgreg OG0000005 LOC126336625 ExpansionStep 2
Then we use the same function we used for DEGs GO terms and KEGG enrichment:
# === Paths and Constants ===
workDir     <- "/Users/maevatecher/Documents/GitHub/locust-comparative-genomics/data"
GODir       <- file.path(workDir, "list", "GO_Annotations")
RefDir      <- file.path(workDir, "RefSeq")
enrichDir   <- file.path(workDir, "cafe5_results/Base_change_FILE")

species_list <- c("gregaria", "cancellata", "piceifrons", "americana", "cubense", "nitens", "locusta")

# === Load Required Libraries ===
library(data.table)
library(dplyr)
library(readr)
library(clusterProfiler)
library(GO.db)
library(rtracklayer)
library(DesertLocustR)  # Local installation

gff_map <- c(
  gregaria   = "GCF_023897955.1_iqSchGreg1.2_genomic.gff",
  cancellata = "GCF_023864275.1_iqSchCanc2.1_genomic.gff",
  piceifrons = "GCF_021461385.2_iqSchPice1.1_genomic.gff",
  americana  = "GCF_021461395.2_iqSchAmer2.1_genomic.gff",
  cubense    = "GCF_023864345.2_iqSchSeri2.2_genomic.gff",
  nitens     = "GCF_023898315.1_iqSchNite1.1_genomic.gff",
  locusta    = "GCF_023897955.1_iqSchGreg1.2_genomic.gff"
)

annot_map <- c(
  gregaria   = "EggNog_Arthropoda_one2one.emapper.annotations",
  cancellata = "GCF_023864275.1_iqSchCanc2.1_Arthopoda_one2one.emapper.annotations",
  piceifrons = "GCF_021461385.2_iqSchPice1.1_Arthopoda_one2one.emapper.annotations",
  americana  = "GCF_021461395.2_iqSchAmer2.1_Arthopoda_one2one.emapper.annotations",
  cubense    = "GCF_023864345.2_iqSchSeri2.2_Arthopoda_one2one.emapper.annotations",
  nitens     = "GCF_023898315.1_iqSchNite1.1_Arthopoda_one2one.emapper.annotations",
  locusta    = "EggNog_Arthropoda_one2one.emapper.annotations"
)

# GO enrichment
enrich_GO <- function(dge_genes.df, term2gene, term2name, pval, qval){
  genes <- rownames(dge_genes.df)
  enricher(
    genes,
    TERM2GENE = term2gene,
    TERM2NAME = term2name,
    pvalueCutoff = pval,
    pAdjustMethod = "BH",
    qvalueCutoff = qval
  )
}

# KEGG preparation
assign_kegg_ids <- function(sig_genes.df){
  if (is.vector(sig_genes.df)) {
    sig_genes.df <- data.frame(X.query = sig_genes.df, stringsAsFactors = FALSE)
  } else {
    sig_genes.df$X.query <- rownames(sig_genes.df)
  }

  dge_with_kegg_ids <- left_join(sig_genes.df, kegg_final, by = "X.query")
  dge_with_kegg_ids$KEGG_ko[grepl("^K", dge_with_kegg_ids$KEGG_ko)]
}


# KEGG enrichment
enrich_KEGG <- function(dge_genes.df, pval_cutoff = 0.05, qval_cutoff = 0.2) {
  gene_with_kegg_ids <- assign_kegg_ids(dge_genes.df)
  enrichKEGG(
    gene         = gene_with_kegg_ids,
    organism     = "ko",
    pvalueCutoff = pval_cutoff,
    qvalueCutoff = qval_cutoff,
    pAdjustMethod = "BH"
  )
}


run_GO_enrichment_selected <- function(
    gene_list,
    go_table,
    term2name,
    species,
    suffix,
    ontology,
    output_dir,
    show_n = 30,
    top_n = 30
) {
  if (length(gene_list) == 0) return(NULL)

  if (!dir.exists(output_dir)) {
    dir.create(output_dir, recursive = TRUE)
  }

  # Make sure column names are correct for clusterProfiler::enricher()
  go_table_fixed <- go_table[, 1:2]
  colnames(go_table_fixed) <- c("go_id", "gene_id")

  term2name_fixed <- term2name[, 1:2]
  colnames(term2name_fixed) <- c("go_id", "name")

  # Run enrichment
  go_result <- enricher(
    gene = gene_list,
    TERM2GENE = go_table_fixed,
    TERM2NAME = term2name_fixed,
    pvalueCutoff = 0.05,
    qvalueCutoff = 0.2
  )

  if (!is.null(go_result) &&
      inherits(go_result, "enrichResult") &&
      nrow(go_result@result) > 0 &&
      sum(!is.na(go_result@result$Description)) > 0) {

    # Save dotplot
    try({
      pdf(file = file.path(output_dir, paste0("GO_", ontology, "_dotplot_", species, "_", suffix, ".pdf")),
          width = 8, height = 6)
      print(dotplot(go_result, showCategory = min(show_n, nrow(go_result@result))) +
              ggtitle(paste(ontology, suffix)))
      dev.off()
    }, silent = TRUE)

    # Export top terms with log10(p)
    species_enrich_ready <- go_result@result[, c("ID", "p.adjust")]
    species_enrich_ready$logp <- -log10(species_enrich_ready$p.adjust)
    species_enrich_ready <- species_enrich_ready[order(-species_enrich_ready$logp), ]
    species_enrich_ready <- head(species_enrich_ready, n = top_n)[, c("ID", "logp")]

    write.table(species_enrich_ready,
                file = file.path(output_dir, paste0("enrich_", ontology, "_GOs_", species, "_", suffix, ".txt")),
                sep = "\t", quote = FALSE, row.names = FALSE, col.names = FALSE)

    # Also export the full table if needed
    write.csv(go_result@result,
              file = file.path(output_dir, paste0("GO_enrichment_full_", ontology, "_", species, "_", suffix, ".csv")),
              row.names = FALSE)

    # ✅ Return enrichment results with Species + ONTOLOGY
    df <- go_result@result %>%
      dplyr::mutate(Species = species, ONTOLOGY = ontology)
    return(df)

  } else {
    message(paste0("⚠️ No GO enrichment result to plot/export for ", species, " - ", suffix, " [", ontology, "]"))
    return(NULL)
  }
}


run_KEGG_enrichment_selected <- function(gene_list, species, suffix, output_dir,
                                         show_n = 40, top_n = 40) {
  if (length(gene_list) == 0) return(NULL)

  kegg_result <- enrich_KEGG(gene_list, pval_cutoff = 0.05, qval_cutoff = 0.2)

  if (!is.null(kegg_result) && inherits(kegg_result, "enrichResult") &&
      nrow(kegg_result@result) > 0) {
    try({
      pdf(file = file.path(output_dir, paste0("KEGG_dotplot_", species, "_", suffix, ".pdf")),
          width = 8, height = 6)
      print(dotplot(kegg_result, showCategory = min(show_n, nrow(kegg_result@result))) +
              ggtitle(paste("KEGG", suffix)))
      dev.off()
    }, silent = TRUE)

    # Full result
    write.csv(kegg_result@result,
              file = file.path(output_dir, paste0("KEGG_enrichment_", species, "_", suffix, ".csv")),
              row.names = FALSE)

    # Top KEGG terms
    species_enrich_kegg <- kegg_result@result[, c("ID", "p.adjust")]
    species_enrich_kegg$logp <- -log10(species_enrich_kegg$p.adjust)
    species_enrich_kegg <- species_enrich_kegg[order(-species_enrich_kegg$logp), ][1:min(nrow(species_enrich_kegg), top_n), ]
    species_enrich_kegg <- species_enrich_kegg[, c("ID", "logp")]

    write.table(species_enrich_kegg[, c("ID", "logp")],
                file = file.path(output_dir, paste0("enrich_KEGG_", species, "_", suffix, ".txt")),
                sep = "\t", quote = FALSE, row.names = FALSE, col.names = FALSE)

    # ✅ return the full result with Species
    df <- as.data.frame(kegg_result@result)
    df$Species <- species
    return(df)

  } else {
    message(paste("⚠️ No KEGG enrichment result to plot/export for", species, "-", suffix))
    return(NULL)
  }
}

GO_terms_list      <- list()
ontologies_list    <- list()
term2name_list     <- list()
kegg_final_list    <- list()

for (sp in species_list) {
  message("Preparing annotations for ", sp)
  sp_code <- species_translate[sp]
  eggnog_path <- file.path(GODir, annot_map[[sp]])
  gff_path    <- file.path(RefDir,  gff_map[[sp]])

  output_dir <- file.path(enrichDir, sp)
  dir.create(output_dir, recursive = TRUE, showWarnings = FALSE)

  eggnog_annots <- read.delim(eggnog_path, sep = "\t", skip = 4)
  eggnog_annots <- eggnog_annots[1:(nrow(eggnog_annots) - 3), ]

  gff.df <- as.data.frame(import(gff_path))
  protein_2_gene <- unique(gff.df[c("Name", "gene")])
  protein_2_gene_df <- subset(protein_2_gene, grepl("^XP", protein_2_gene$Name))

  eggnog_annots$Name <- eggnog_annots$X.query
  eggnog_annots <- left_join(eggnog_annots, protein_2_gene_df, by = "Name")
  eggnog_annots$X.query <- eggnog_annots$gene

  # GO
  GO_terms <- data.table(eggnog_annots[, c("X.query", "GOs")])
  GO_terms <- GO_terms[, .(GOs = unlist(strsplit(GOs, ","))), by = X.query]
  term2name <- GO_terms[, .(GOs, X.query)]
  term2name$Names <- mapIds(GO.db, keys = term2name$GOs, column = "TERM", keytype = "GOID")
  term2name$Ontology <- mapIds(GO.db, keys = term2name$GOs, column = "ONTOLOGY", keytype = "GOID")
  term2name <- as.data.frame(term2name)

  go_bp <- term2name[term2name$Ontology == "BP", c("GOs", "X.query")]
  go_mf <- term2name[term2name$Ontology == "MF", c("GOs", "X.query")]
  go_cc <- term2name[term2name$Ontology == "CC", c("GOs", "X.query")]
  term2name_filtered <- term2name[!is.na(term2name$Names), c("GOs", "Names")]
  ontologies <- list(BP = go_bp, MF = go_mf, CC = go_cc)

  # KEGG
  KO_terms <- data.table(eggnog_annots[, c("X.query", "KEGG_ko")])
  KO_terms$KEGG_ko <- gsub("ko:", "", as.character(KO_terms$KEGG_ko))
  KO_terms <- KO_terms[, .(KEGG_ko = unlist(strsplit(KEGG_ko, ","))), by = X.query]
  kegg_final <- KO_terms[, .(KEGG_ko, X.query)]

  # Store per species
  GO_terms_list[[sp]]     <- GO_terms
  ontologies_list[[sp]]   <- ontologies
  term2name_list[[sp]]    <- term2name_filtered
  kegg_final_list[[sp]]   <- kegg_final
}
Step 3
We run the loop using the the list of selected genes extracted in step 1:
suffix <- "cafe"

species_translate <- c(
  gregaria   = "Sgreg",
  cancellata = "Scanc",
  piceifrons = "Spice",
  americana  = "Samer",
  cubense    = "Sscub",
  nitens     = "Snite",
  locusta    = "Lmigr"   # proxy annotation from gregaria
)

# ===== Loop through each species =====
go_results_all <- list()
kegg_results_all <- list()

# initialize diagnostic log
diagnostic_log <- data.frame(
  Species = character(),
  ChangeType   = character(),
  CAFE_genes = integer(),
  GO_overlap = integer(),
  KEGG_overlap = integer(),
  stringsAsFactors = FALSE
)

for (sp in species_list) {
  sp_code <- species_translate[sp]

  for (chg in c("Expansion", "Contraction")) {
    message("Processing ", sp, " (", chg, ")")

    output_dir <- file.path(enrichDir, sp, chg)
    dir.create(output_dir, recursive = TRUE, showWarnings = FALSE)

  # 1. Extract cafe GeneIDs for this species
    species_genes <- cafe_genes %>%
      filter(Species == sp_code, ChangeType == chg) %>%
      pull(GeneID) %>%
      unique()

    n_cafe <- length(species_genes)
    message("→ ", n_cafe, " Gene families with ", chg, " in ", sp)

  # 2. Check overlaps with GO and KEGG annotations
  go_annot   <- GO_terms_list[[sp]]$X.query
  kegg_annot <- kegg_final_list[[sp]]$X.query

  go_overlap   <- sum(species_genes %in% go_annot)
  kegg_overlap <- sum(species_genes %in% kegg_annot)

  message("→ Overlap counts: GO = ", go_overlap, ", KEGG = ", kegg_overlap)

  if (kegg_overlap == 0) {
    message("  ⚠️ No KEGG matches for ", sp,
            ". Example missing IDs: ",
            paste(head(setdiff(species_genes, kegg_annot), 5), collapse = ", "))
  }

  # Add to diagnostic log
    diagnostic_log <- rbind(diagnostic_log, data.frame(
      Species      = sp,
      ChangeType   = chg,
      CAFE_genes   = n_cafe,
      GO_overlap   = go_overlap,
      KEGG_overlap = kegg_overlap
    ))


  # 3. Run GO enrichment (BP, MF, CC separately)
  selected_genes_go <- species_genes[species_genes %in% go_annot]
  go_by_onto <- list()

    for (onto in names(ontologies_list[[sp]])) {
      go_res <- run_GO_enrichment_selected(
        gene_list  = selected_genes_go,
        go_table   = ontologies_list[[sp]][[onto]],
        term2name  = term2name_list[[sp]],
        species    = paste0(sp, "_", chg),
        suffix     = suffix,
        ontology   = onto,
        output_dir = output_dir
      )

      if (!is.null(go_res)) {
        go_res <- as.data.frame(go_res) %>%
          mutate(Species = sp, ChangeType = chg, ONTOLOGY = onto)
        go_by_onto[[onto]] <- go_res
      }
    }

    go_results_all[[paste0(sp, "_", chg)]] <- go_by_onto

  # 4. Run KEGG enrichment
    selected_genes_kegg <- species_genes[species_genes %in% kegg_annot]
    kegg_final <<- kegg_final_list[[sp]]
    kegg_res <- run_KEGG_enrichment_selected(
      gene_list  = selected_genes_kegg,
      species    = paste0(sp, "_", chg),
      suffix     = suffix,
      output_dir = output_dir
    )

    if (!is.null(kegg_res)) {
      kegg_results_all[[paste0(sp, "_", chg)]] <- kegg_res %>%
        mutate(Species = sp, ChangeType = chg)
    }
  }
}

# save diagnostic log
write.csv(diagnostic_log,
          file.path(enrichDir, "diagnostic_overlap_log.csv"),
          row.names = FALSE)
print(diagnostic_log)
Species ChangeType CAFE_genes GO_overlap KEGG_overlap
1 gregaria Expansion 1178 927 927
2 gregaria Contraction 123 108 108
3 cancellata Expansion 831 640 640
4 cancellata Contraction 215 177 177
5 piceifrons Expansion 1057 793 793
6 piceifrons Contraction 177 150 150
7 americana Expansion 687 568 568
8 americana Contraction 184 135 135
9 cubense Expansion 824 623 623
10 cubense Contraction 189 171 171
11 nitens Expansion 830 599 599
12 nitens Contraction 238 215 215
13 locusta Expansion 2162 2013 2013
14 locusta Contraction 843 704 704Step 4
We need to make a heat map with all species:
library(dplyr)
library(tidyr)
library(pheatmap)
library(tibble)

# 1. Flatten all species results
all_go_results <- bind_rows(
  lapply(go_results_all, function(sp_list) bind_rows(sp_list))
)

# 2. Loop through each ontology
for (onto in c("BP", "MF", "CC")) {

  # Filter for this ontology
  onto_res <- all_go_results %>% filter(ONTOLOGY == onto)
  if (nrow(onto_res) == 0) {
    message("⚠️ No results for ", onto)
    next
  }

  # 3. Take top 10 per species
  top_go <- onto_res %>%
    group_by(Species, ChangeType) %>%
    slice_min(order_by = p.adjust, n = 15, with_ties = FALSE) %>%
    ungroup()

    # Add signed score: expansions positive, contractions negative
  top_go <- top_go %>%
    mutate(score = -log10(p.adjust) * ifelse(ChangeType == "Contraction", -1, 1))

  # Build matrix
# Build matrix
heatmap_mat <- top_go %>%
  dplyr::select(Description, Species, ChangeType, score) %>%
  pivot_wider(names_from = Description, values_from = score, values_fill = 0) %>%
  mutate(RowID = paste(Species, ChangeType, sep = "_")) %>%
  column_to_rownames("RowID")

# 🔑 Ensure only numeric columns remain
heatmap_mat <- heatmap_mat %>%
  dplyr::select(where(is.numeric)) %>%
  as.matrix()


# Define desired species order
species_order <- c("locusta", "gregaria", "nitens",
                   "cancellata", "piceifrons", "americana", "cubense")

row_order <- unlist(lapply(species_order, function(sp) c(paste0(sp, "_Expansion"),
                                                          paste0(sp, "_Contraction"))))

heatmap_mat <- heatmap_mat[row_order[row_order %in% rownames(heatmap_mat)], , drop = FALSE]

# Set color scale: 0 = white, gradient for >0
  max_val <- max(abs(heatmap_mat), na.rm = TRUE)
  breaks <- seq(-max_val, max_val, length.out = 101)
  colors <- colorRampPalette(c("blue", "white", "orange"))(100)

# Save heatmap
out_pdf <- file.path(enrichDir, paste0("GO_", onto, "_heatmap_top15_ExpVsCon.pdf"))
pdf(out_pdf, width = 12, height = 6)
pheatmap(
  mat = heatmap_mat,
  cluster_rows = FALSE,  # keep species order fixed
  cluster_cols = FALSE,   # cluster GO terms
  scale = "none",
  fontsize_row = 12,
  fontsize_col = 6,
  angle_col = 90,
  color = colors,
  breaks = breaks,
  main = paste("Top 10 GO",
               ifelse(onto == "BP", "Biological Process",
                      ifelse(onto == "MF", "Molecular Function", "Cellular Component")),
               "terms per species")
)
dev.off()

}
Step 5
This code is to make a KEGG pathway enrichment:
library(dplyr)
library(tidyr)
library(ggplot2)

# === Collect KEGG results ===
all_kegg_results <- bind_rows(
  lapply(names(kegg_results_all), function(sp) {
    kegg_results_all[[sp]]
  })
)

# === Take top 15 per species (expansion + contraction separately) ===
top_kegg <- all_kegg_results %>%
  group_by(Species, ChangeType) %>%
  slice_min(order_by = p.adjust, n = 15, with_ties = FALSE) %>%
  ungroup()

# === Clean dataframe ===
heatmap_df_kegg <- top_kegg %>%
  dplyr::select(Species, category, subcategory, Count, ChangeType) %>%
  filter(!is.na(category), !is.na(subcategory)) %>%
  mutate(Count = as.numeric(Count))

# === Species order ===
species_order <- c("cubense", "americana", "piceifrons",
                   "cancellata", "nitens", "gregaria", "locusta")
heatmap_df_kegg$Species <- factor(heatmap_df_kegg$Species, levels = species_order)

# === Subcategory order within each category ===
heatmap_df_kegg <- heatmap_df_kegg %>%
  group_by(category) %>%
  mutate(subcategory = factor(subcategory, levels = unique(subcategory))) %>%
  ungroup()

# === Shared max value for scales ===
max_val <- max(heatmap_df_kegg$Count, na.rm = TRUE)

# === Expansion heatmap (red) ===
out_pdf_exp <- file.path(enrichDir, "KEGG_subcategory_faceted_heatmap_Expansion.pdf")
pdf(out_pdf_exp, width = 14, height = 8)

ggplot(filter(heatmap_df_kegg, ChangeType == "Expansion"),
       aes(x = subcategory, y = Species, fill = Count)) +
  geom_tile(color = "black", size = 0.3) +
  scale_fill_gradientn(colors = c("white", "turquoise3", "blue"),
                       limits = c(0, 26),
                       name = "# Genes Expanded") +
  facet_wrap(~ category, scales = "free_x", nrow = 1) +
  theme_minimal(base_size = 12) +
  theme(
    axis.text.x = element_text(angle = 90, hjust = 1, vjust = 1, size = 12),
    axis.text.y = element_text(size = 12),
    panel.grid = element_blank(),
    strip.text = element_text(face = "bold", size = 8)
  ) +
  labs(title = "",
       x = "", y = "")

dev.off()
quartz_off_screen
2 # === Contraction heatmap (blue) ===
out_pdf_con <- file.path(enrichDir, "KEGG_subcategory_faceted_heatmap_Contraction.pdf")
pdf(out_pdf_con, width = 14, height = 8)
ggplot(filter(heatmap_df_kegg, ChangeType == "Contraction"),
aes(x = subcategory, y = Species, fill = Count)) +
geom_tile(color = "black", size = 0.3) +
scale_fill_gradientn(colors = c("white", "orange", "darkred"),
limits = c(0, 15),
name = "# Genes Contracted") +
facet_wrap(~ category, scales = "free_x", nrow = 1) +
theme_minimal(base_size = 12) +
theme(
axis.text.x = element_text(angle = 45, hjust = 1, vjust = 1, size = 12),
axis.text.y = element_text(size = 9),
panel.grid = element_blank(),
strip.text = element_text(face = "bold", size = 8)
) +
labs(title = "Top 15 KEGG subcategories per species (Contractions)",
x = "Subcategory", y = "Species")
dev.off()quartz_off_screen
2 Gene count
Step 1
library(dplyr)
library(tidyr)
library(readr)
library(purrr)

# Load files
gene_count <- read.delim("/Users/maevatecher/Documents/GitHub/locust-comparative-genomics/data/cafe5_results/Orthogroups.GeneCount.tsv", sep = "\t", header = TRUE, check.names = FALSE)

# 2. Remove `_filteredTranscripts` suffix from column names
colnames(gene_count) <- gsub("_filteredTranscripts", "", colnames(gene_count))

# 3. Pivot longer for easier handling (Orthogroup–Species–Count format)
gene_count_long <- gene_count %>%
  pivot_longer(
    cols = -Orthogroup,
    names_to = "Species",
    values_to = "Count"
  )

# ✅ Now gene_count_long has clean species names
head(gene_count_long)
# A tibble: 6 × 3
Orthogroup Species Count
<chr> <chr> <int>
1 OG0000000 Asimp 6
2 OG0000000 Brsri 10
3 OG0000000 Csecu 20
4 OG0000000 Gbima 1
5 OG0000000 Glong 17
6 OG0000000 Lmigr 12# -------------------------
# Load orthogroup map
# -------------------------
ortho_dir <- "/Users/maevatecher/Documents/GitHub/locust-comparative-genomics/data/orthofinder/Polyneoptera"
input_file <- file.path(ortho_dir, "Results_I2_iqtree/Orthogroups_genesproteinbiotype_13species_annotated_May2025.csv")
ortho_map <- read.csv(input_file, header = TRUE, stringsAsFactors = FALSE)
# -------------------------
# Species translation
# -------------------------
species_translate <- c(
Sgreg = "gregaria",
Scanc = "cancellata",
Spice = "piceifrons",
Samer = "americana",
Sscub = "cubense",
Snite = "nitens",
Lmigr = "locusta"
)
# -------------------------
# Build expanded_genes tibble
# -------------------------
cafe_genes <- map_dfr(names(species_translate), function(sp) {
message("Collecting expanded OGs for ", sp)
expanded_ogs <- gene_count %>%
filter(!!sym(sp) > 10) %>%
pull(Orthogroup)
# If Lmigr -> reuse Sgreg’s genes
if (sp == "Lmigr") {
proxy_sp <- "Sgreg"
} else {
proxy_sp <- sp
}
ortho_map %>%
filter(Species == proxy_sp, Orthogroup %in% expanded_ogs) %>%
mutate(Species = sp) %>% # keep label as Lmigr
dplyr::select(Species, Orthogroup, GeneID) %>%
distinct()
})
# Preview
head(cafe_genes) Species Orthogroup GeneID
1 Sgreg OG0000000 LOC126284328
2 Sgreg OG0000000 LOC126284627
3 Sgreg OG0000000 LOC126285012
4 Sgreg OG0000000 LOC126291426
5 Sgreg OG0000000 LOC126335618
6 Sgreg OG0000000 LOC126335743Step 2
Then we use the same function we used for DEGs GO terms and KEGG enrichment:
# === Paths and Constants ===
workDir     <- "/Users/maevatecher/Documents/GitHub/locust-comparative-genomics/data"
GODir       <- file.path(workDir, "list", "GO_Annotations")
RefDir      <- file.path(workDir, "RefSeq")
enrichDir   <- file.path(workDir, "cafe5_results/Gene_count_FILE")

species_list <- c("gregaria", "cancellata", "piceifrons", "americana", "cubense", "nitens", "locusta")

# === Load Required Libraries ===
library(data.table)
library(dplyr)
library(readr)
library(clusterProfiler)
library(GO.db)
library(rtracklayer)
library(DesertLocustR)  # Local installation

gff_map <- c(
  gregaria   = "GCF_023897955.1_iqSchGreg1.2_genomic.gff",
  cancellata = "GCF_023864275.1_iqSchCanc2.1_genomic.gff",
  piceifrons = "GCF_021461385.2_iqSchPice1.1_genomic.gff",
  americana  = "GCF_021461395.2_iqSchAmer2.1_genomic.gff",
  cubense    = "GCF_023864345.2_iqSchSeri2.2_genomic.gff",
  nitens     = "GCF_023898315.1_iqSchNite1.1_genomic.gff",
  locusta    = "GCF_023897955.1_iqSchGreg1.2_genomic.gff"
)

annot_map <- c(
  gregaria   = "EggNog_Arthropoda_one2one.emapper.annotations",
  cancellata = "GCF_023864275.1_iqSchCanc2.1_Arthopoda_one2one.emapper.annotations",
  piceifrons = "GCF_021461385.2_iqSchPice1.1_Arthopoda_one2one.emapper.annotations",
  americana  = "GCF_021461395.2_iqSchAmer2.1_Arthopoda_one2one.emapper.annotations",
  cubense    = "GCF_023864345.2_iqSchSeri2.2_Arthopoda_one2one.emapper.annotations",
  nitens     = "GCF_023898315.1_iqSchNite1.1_Arthopoda_one2one.emapper.annotations",
  locusta    = "EggNog_Arthropoda_one2one.emapper.annotations"
)

# GO enrichment
# GO enrichment
enrich_GO <- function(dge_genes.df, term2gene, term2name, pval, qval){
  genes <- rownames(dge_genes.df)
  enricher(
    genes,
    TERM2GENE = term2gene,
    TERM2NAME = term2name,
    pvalueCutoff = pval,
    pAdjustMethod = "BH",
    qvalueCutoff = qval
  )
}

# KEGG preparation
assign_kegg_ids <- function(sig_genes.df){
  if (is.vector(sig_genes.df)) {
    sig_genes.df <- data.frame(X.query = sig_genes.df, stringsAsFactors = FALSE)
  } else {
    sig_genes.df$X.query <- rownames(sig_genes.df)
  }

  dge_with_kegg_ids <- left_join(sig_genes.df, kegg_final, by = "X.query")
  dge_with_kegg_ids$KEGG_ko[grepl("^K", dge_with_kegg_ids$KEGG_ko)]
}


# KEGG enrichment
enrich_KEGG <- function(dge_genes.df, pval_cutoff = 0.05, qval_cutoff = 0.2) {
  gene_with_kegg_ids <- assign_kegg_ids(dge_genes.df)
  enrichKEGG(
    gene         = gene_with_kegg_ids,
    organism     = "ko",
    pvalueCutoff = pval_cutoff,
    qvalueCutoff = qval_cutoff,
    pAdjustMethod = "BH"
  )
}


run_GO_enrichment_selected <- function(
    gene_list,
    go_table,
    term2name,
    species,
    suffix,
    ontology,
    output_dir,
    show_n = 30,
    top_n = 30
) {
  if (length(gene_list) == 0) return(NULL)

  if (!dir.exists(output_dir)) {
    dir.create(output_dir, recursive = TRUE)
  }

  # Make sure column names are correct for clusterProfiler::enricher()
  go_table_fixed <- go_table[, 1:2]
  colnames(go_table_fixed) <- c("go_id", "gene_id")

  term2name_fixed <- term2name[, 1:2]
  colnames(term2name_fixed) <- c("go_id", "name")

  # Run enrichment
  go_result <- enricher(
    gene = gene_list,
    TERM2GENE = go_table_fixed,
    TERM2NAME = term2name_fixed,
    pvalueCutoff = 0.05,
    qvalueCutoff = 0.2
  )

  if (!is.null(go_result) &&
      inherits(go_result, "enrichResult") &&
      nrow(go_result@result) > 0 &&
      sum(!is.na(go_result@result$Description)) > 0) {

    # Save dotplot
    try({
      pdf(file = file.path(output_dir, paste0("GO_", ontology, "_dotplot_", species, "_", suffix, ".pdf")),
          width = 8, height = 6)
      print(dotplot(go_result, showCategory = min(show_n, nrow(go_result@result))) +
              ggtitle(paste(ontology, suffix)))
      dev.off()
    }, silent = TRUE)

    # Export top terms with log10(p)
    species_enrich_ready <- go_result@result[, c("ID", "p.adjust")]
    species_enrich_ready$logp <- -log10(species_enrich_ready$p.adjust)
    species_enrich_ready <- species_enrich_ready[order(-species_enrich_ready$logp), ]
    species_enrich_ready <- head(species_enrich_ready, n = top_n)[, c("ID", "logp")]

    write.table(species_enrich_ready,
                file = file.path(output_dir, paste0("enrich_", ontology, "_GOs_", species, "_", suffix, ".txt")),
                sep = "\t", quote = FALSE, row.names = FALSE, col.names = FALSE)

    # Also export the full table if needed
    write.csv(go_result@result,
              file = file.path(output_dir, paste0("GO_enrichment_full_", ontology, "_", species, "_", suffix, ".csv")),
              row.names = FALSE)

    # ✅ Return enrichment results with Species + ONTOLOGY
    df <- go_result@result %>%
      dplyr::mutate(Species = species, ONTOLOGY = ontology)
    return(df)

  } else {
    message(paste0("⚠️ No GO enrichment result to plot/export for ", species, " - ", suffix, " [", ontology, "]"))
    return(NULL)
  }
}


run_KEGG_enrichment_selected <- function(gene_list, species, suffix, output_dir,
                                         show_n = 40, top_n = 40) {
  if (length(gene_list) == 0) return(NULL)

  kegg_result <- enrich_KEGG(gene_list, pval_cutoff = 0.05, qval_cutoff = 0.2)

  if (!is.null(kegg_result) && inherits(kegg_result, "enrichResult") &&
      nrow(kegg_result@result) > 0) {
    try({
      pdf(file = file.path(output_dir, paste0("KEGG_dotplot_", species, "_", suffix, ".pdf")),
          width = 8, height = 6)
      print(dotplot(kegg_result, showCategory = min(show_n, nrow(kegg_result@result))) +
              ggtitle(paste("KEGG", suffix)))
      dev.off()
    }, silent = TRUE)

    # Full result
    write.csv(kegg_result@result,
              file = file.path(output_dir, paste0("KEGG_enrichment_", species, "_", suffix, ".csv")),
              row.names = FALSE)

    # Top KEGG terms
    species_enrich_kegg <- kegg_result@result[, c("ID", "p.adjust")]
    species_enrich_kegg$logp <- -log10(species_enrich_kegg$p.adjust)
    species_enrich_kegg <- species_enrich_kegg[order(-species_enrich_kegg$logp), ][1:min(nrow(species_enrich_kegg), top_n), ]
    species_enrich_kegg <- species_enrich_kegg[, c("ID", "logp")]

    write.table(species_enrich_kegg[, c("ID", "logp")],
                file = file.path(output_dir, paste0("enrich_KEGG_", species, "_", suffix, ".txt")),
                sep = "\t", quote = FALSE, row.names = FALSE, col.names = FALSE)

    # ✅ return the full result with Species
    df <- as.data.frame(kegg_result@result)
    df$Species <- species
    return(df)

  } else {
    message(paste("⚠️ No KEGG enrichment result to plot/export for", species, "-", suffix))
    return(NULL)
  }
}

GO_terms_list      <- list()
ontologies_list    <- list()
term2name_list     <- list()
kegg_final_list    <- list()

for (sp in species_list) {
  message("Preparing annotations for ", sp)
  sp_code <- species_translate[sp]
  eggnog_path <- file.path(GODir, annot_map[[sp]])
  gff_path    <- file.path(RefDir,  gff_map[[sp]])

  output_dir <- file.path(enrichDir, sp)
  dir.create(output_dir, recursive = TRUE, showWarnings = FALSE)

  eggnog_annots <- read.delim(eggnog_path, sep = "\t", skip = 4)
  eggnog_annots <- eggnog_annots[1:(nrow(eggnog_annots) - 3), ]

  gff.df <- as.data.frame(import(gff_path))
  protein_2_gene <- unique(gff.df[c("Name", "gene")])
  protein_2_gene_df <- subset(protein_2_gene, grepl("^XP", protein_2_gene$Name))

  eggnog_annots$Name <- eggnog_annots$X.query
  eggnog_annots <- left_join(eggnog_annots, protein_2_gene_df, by = "Name")
  eggnog_annots$X.query <- eggnog_annots$gene

  # GO
  GO_terms <- data.table(eggnog_annots[, c("X.query", "GOs")])
  GO_terms <- GO_terms[, .(GOs = unlist(strsplit(GOs, ","))), by = X.query]
  term2name <- GO_terms[, .(GOs, X.query)]
  term2name$Names <- mapIds(GO.db, keys = term2name$GOs, column = "TERM", keytype = "GOID")
  term2name$Ontology <- mapIds(GO.db, keys = term2name$GOs, column = "ONTOLOGY", keytype = "GOID")
  term2name <- as.data.frame(term2name)

  go_bp <- term2name[term2name$Ontology == "BP", c("GOs", "X.query")]
  go_mf <- term2name[term2name$Ontology == "MF", c("GOs", "X.query")]
  go_cc <- term2name[term2name$Ontology == "CC", c("GOs", "X.query")]
  term2name_filtered <- term2name[!is.na(term2name$Names), c("GOs", "Names")]
  ontologies <- list(BP = go_bp, MF = go_mf, CC = go_cc)

  # KEGG
  KO_terms <- data.table(eggnog_annots[, c("X.query", "KEGG_ko")])
  KO_terms$KEGG_ko <- gsub("ko:", "", as.character(KO_terms$KEGG_ko))
  KO_terms <- KO_terms[, .(KEGG_ko = unlist(strsplit(KEGG_ko, ","))), by = X.query]
  kegg_final <- KO_terms[, .(KEGG_ko, X.query)]

  # Store per species
  GO_terms_list[[sp]]     <- GO_terms
  ontologies_list[[sp]]   <- ontologies
  term2name_list[[sp]]    <- term2name_filtered
  kegg_final_list[[sp]]   <- kegg_final
}
Step 3
We run the loop using the the list of selected genes extracted in step 1:
suffix <- "cafe"

species_translate <- c(
  gregaria   = "Sgreg",
  cancellata = "Scanc",
  piceifrons = "Spice",
  americana  = "Samer",
  cubense    = "Sscub",
  nitens     = "Snite",
  locusta    = "Lmigr"   # proxy annotation from gregaria
)

# ===== Loop through each species =====
go_results_all <- list()
kegg_results_all <- list()

# initialize diagnostic log
diagnostic_log <- data.frame(
  Species = character(),
  CAFE_genes = integer(),
  GO_overlap = integer(),
  KEGG_overlap = integer(),
  stringsAsFactors = FALSE
)

for (sp in species_list) {
  message("Processing ", sp)
  sp_code <- species_translate[sp]
  output_dir <- file.path(enrichDir, sp)
  dir.create(output_dir, recursive = TRUE, showWarnings = FALSE)

  # 1. Extract cafe GeneIDs for this species
  species_genes <- cafe_genes %>%
    filter(Species == sp_code) %>%
    pull(GeneID) %>%
    unique()

  n_cafe <- length(species_genes)
  message("→ ", n_cafe, " Gene families expanding in ", sp)

  # 2. Check overlaps with GO and KEGG annotations
  go_annot   <- GO_terms_list[[sp]]$X.query
  kegg_annot <- kegg_final_list[[sp]]$X.query

  go_overlap   <- sum(species_genes %in% go_annot)
  kegg_overlap <- sum(species_genes %in% kegg_annot)

  message("→ Overlap counts: GO = ", go_overlap, ", KEGG = ", kegg_overlap)

  if (kegg_overlap == 0) {
    message("  ⚠️ No KEGG matches for ", sp,
            ". Example missing IDs: ",
            paste(head(setdiff(species_genes, kegg_annot), 5), collapse = ", "))
  }

  # Add to diagnostic log
  diagnostic_log <- rbind(diagnostic_log, data.frame(
    Species = sp,
    CAFE_genes = n_cafe,
    GO_overlap = go_overlap,
    KEGG_overlap = kegg_overlap
  ))

  # 3. Run GO enrichment (BP, MF, CC separately)
  selected_genes_go <- species_genes[species_genes %in% go_annot]
  go_by_onto <- list()
  for (onto in names(ontologies_list[[sp]])) {
    go_res <- run_GO_enrichment_selected(
      gene_list  = selected_genes_go,
      go_table   = ontologies_list[[sp]][[onto]],   # term2gene mapping
      term2name  = term2name_list[[sp]],            # term2name mapping
      species    = sp,
      suffix     = suffix,
      ontology   = onto,
      output_dir = output_dir
    )
    if (!is.null(go_res)) {
    go_res <- as.data.frame(go_res) %>%
      mutate(Species = sp, ONTOLOGY = onto)   # 👈 add both species + ontology here
    go_by_onto[[onto]] <- go_res
  }
}
  go_results_all[[sp]] <- go_by_onto

  # 4. Run KEGG enrichment
  selected_genes_kegg <- species_genes[species_genes %in% kegg_annot]
  kegg_final <<- kegg_final_list[[sp]]  # required by assign_kegg_ids()
  kegg_results_all[[sp]] <- run_KEGG_enrichment_selected(
    gene_list  = selected_genes_kegg,
    species    = sp,
    suffix     = suffix,
    output_dir = output_dir
  )
}

# save diagnostic log
write.csv(diagnostic_log, file.path(enrichDir, "diagnostic_overlap_log.csv"), row.names = FALSE)
print(diagnostic_log)
Species CAFE_genes GO_overlap KEGG_overlap
1 gregaria 817 500 500
2 cancellata 916 569 569
3 piceifrons 1146 588 588
4 americana 1413 825 825
5 cubense 965 620 620
6 nitens 1169 472 472
7 locusta 352 272 272Step 4
We need to make a heat map with all species:
library(dplyr)
library(tidyr)
library(pheatmap)
library(tibble)

# 1. Flatten all species results
all_go_results <- bind_rows(lapply(go_results_all, bind_rows))

# 2. Loop through each ontology
for (onto in c("BP", "MF", "CC")) {

  # Filter for this ontology
  onto_res <- all_go_results %>% filter(ONTOLOGY == onto)

  # Skip if empty
  if (nrow(onto_res) == 0) {
    message("⚠️ No results for ", onto)
    next
  }

  # 3. Take top 10 per species
  top_go <- onto_res %>%
    group_by(Species) %>%
    slice_min(order_by = p.adjust, n = 15, with_ties = FALSE) %>%
    ungroup()

  # 4. Build matrix of -log10(p.adjust)
  heatmap_mat <- top_go %>%
    mutate(score = -log10(p.adjust)) %>%
    dplyr::select(Description, Species, score) %>%
    pivot_wider(names_from = Species, values_from = score, values_fill = 0) %>%
    column_to_rownames("Description") %>%
    as.matrix()

# Define desired species order
species_order <- c("locusta", "gregaria", "nitens",
                   "cancellata", "piceifrons", "americana", "cubense")

# Flip matrix: species as rows, GO terms as columns
heatmap_mat_flipped <- t(heatmap_mat)

# Reorder rows to match your desired order
heatmap_mat_flipped <- heatmap_mat_flipped[species_order, , drop = FALSE]

# Set color scale: 0 = white, gradient for >0
max_val <- max(heatmap_mat_flipped, na.rm = TRUE)
breaks <- c(0, seq(1e-6, max_val, length.out = 100))
colors <- c("white", colorRampPalette(c("orange", "darkred"))(length(breaks) - 2))

# Save heatmap
out_pdf <- file.path(enrichDir, paste0("GO_", onto, "_heatmap_top15.pdf"))
pdf(out_pdf, width = 12, height = 6)
pheatmap(
  mat = heatmap_mat_flipped,
  cluster_rows = FALSE,  # keep species order fixed
  cluster_cols = FALSE,   # cluster GO terms
  scale = "none",
  fontsize_row = 12,
  fontsize_col = 6,
  angle_col = 90,
  color = colors,
  breaks = breaks,
  main = paste("Top 10 GO",
               ifelse(onto == "BP", "Biological Process",
                      ifelse(onto == "MF", "Molecular Function", "Cellular Component")),
               "terms per species")
)
dev.off()

}
Step 5
This code is to make a KEGG pathway enrichment:
library(dplyr)
library(tidyr)
library(pheatmap)

# === Collect KEGG results ===
all_kegg_results <- bind_rows(
  lapply(names(kegg_results_all), function(sp) {
    kegg_results_all[[sp]]  # now each is already a df with Species
  })
)

# === Take top 10 per species ===
top_kegg <- all_kegg_results %>%
  group_by(Species) %>%
  slice_min(order_by = p.adjust, n = 15, with_ties = FALSE) %>%
  ungroup()


library(dplyr)
library(tidyr)
library(ggplot2)

# === Start from top_kegg ===
heatmap_df_kegg <- top_kegg %>%
  dplyr::select(Species, category, subcategory, Count) %>%
  filter(!is.na(category), !is.na(subcategory)) %>%
  group_by(Species, category, subcategory) %>%
  summarise(Count = max(Count, na.rm = TRUE), .groups = "drop")

# Fix Species order (rows)
species_order <- c( "cubense", "americana","piceifrons","cancellata","nitens", "gregaria","locusta")


heatmap_df_kegg$Species <- factor(heatmap_df_kegg$Species, levels = species_order)

# Optional: order subcategories alphabetically within each category
heatmap_df_kegg <- heatmap_df_kegg %>%
  group_by(category) %>%
  mutate(subcategory = factor(subcategory, levels = unique(subcategory))) %>%
  ungroup()

# === Set color scale (white for 0, gradient for >0) ===
max_val <- max(heatmap_df_kegg$Count, na.rm = TRUE)
colors <- c("white", colorRampPalette(c("orange", "darkred"))(10))


# === Plot with ggplot2 ===
out_pdf <- file.path(enrichDir, "KEGG_subcategory_faceted_heatmap_Count.pdf")
pdf(out_pdf, width = 14, height = 8)

ggplot(heatmap_df_kegg, aes(x = subcategory, y = Species, fill = Count)) +
  geom_tile(color = "black", size = 0.3, na.rm = FALSE) +
  scale_fill_gradientn(colors = colors, limits = c(0, max_val)) +
  facet_wrap(~ category, scales = "free_x", nrow = 1) +
  theme_minimal(base_size = 12) +
  theme(
    axis.text.x = element_text(angle = 45, hjust = 1, vjust = 1, size = 8),
    axis.text.y = element_text(size = 9),
    panel.grid = element_blank(),
    strip.text = element_text(face = "bold", size = 8)
  ) +
  labs(
    title = "Top 20 KEGG subcategories per species (colored by gene count)",
    x = "Subcategory",
    y = "Species",
    fill = "# Genes"
  )

dev.off()
quartz_off_screen
2
sessionInfo()R version 4.4.2 (2024-10-31)
Platform: aarch64-apple-darwin20
Running under: macOS Sequoia 15.7.4
Matrix products: default
BLAS: /Library/Frameworks/R.framework/Versions/4.4-arm64/Resources/lib/libRblas.0.dylib
LAPACK: /Library/Frameworks/R.framework/Versions/4.4-arm64/Resources/lib/libRlapack.dylib; LAPACK version 3.12.0
locale:
[1] en_US.UTF-8/en_US.UTF-8/en_US.UTF-8/C/en_US.UTF-8/en_US.UTF-8
time zone: Asia/Tokyo
tzcode source: internal
attached base packages:
[1] stats4 stats graphics grDevices utils datasets methods
[8] base
other attached packages:
[1] tibble_3.3.1 pheatmap_1.0.13 DesertLocustR_0.1.0
[4] remotes_2.5.0 Biostrings_2.74.1 XVector_0.46.0
[7] AnnotationHub_3.14.0 BiocFileCache_2.14.0 dbplyr_2.5.1
[10] rtracklayer_1.66.0 GenomicRanges_1.58.0 GenomeInfoDb_1.42.3
[13] GO.db_3.20.0 AnnotationDbi_1.68.0 IRanges_2.40.1
[16] S4Vectors_0.44.0 Biobase_2.66.0 BiocGenerics_0.52.0
[19] clusterProfiler_4.14.6 data.table_1.18.0 purrr_1.2.1
[22] kableExtra_1.4.0 knitr_1.51 ggVennDiagram_1.5.7
[25] ggplot2_4.0.2 readr_2.1.6 tidyr_1.3.2
[28] dplyr_1.1.4 workflowr_1.7.2
loaded via a namespace (and not attached):
[1] splines_4.4.2 later_1.4.5
[3] BiocIO_1.16.0 bitops_1.0-9
[5] ggplotify_0.1.3 filelock_1.0.3
[7] R.oo_1.27.1 XML_3.99-0.20
[9] lifecycle_1.0.5 rprojroot_2.1.1
[11] processx_3.8.6 lattice_0.22-7
[13] magrittr_2.0.4 sass_0.4.10
[15] rmarkdown_2.30 jquerylib_0.1.4
[17] yaml_2.3.12 httpuv_1.6.16
[19] otel_0.2.0 ggtangle_0.1.1
[21] cowplot_1.2.0 DBI_1.2.3
[23] RColorBrewer_1.1-3 abind_1.4-8
[25] zlibbioc_1.52.0 R.utils_2.13.0
[27] RCurl_1.98-1.17 yulab.utils_0.2.3
[29] rappdirs_0.3.4 git2r_0.36.2
[31] GenomeInfoDbData_1.2.13 enrichplot_1.26.6
[33] ggrepel_0.9.6 tidytree_0.4.7
[35] svglite_2.2.2 codetools_0.2-20
[37] DelayedArray_0.32.0 DOSE_4.0.1
[39] xml2_1.5.2 tidyselect_1.2.1
[41] aplot_0.2.9 UCSC.utils_1.2.0
[43] farver_2.1.2 matrixStats_1.5.0
[45] GenomicAlignments_1.42.0 jsonlite_2.0.0
[47] systemfonts_1.3.1 tools_4.4.2
[49] treeio_1.30.0 Rcpp_1.1.1
[51] glue_1.8.0 SparseArray_1.6.2
[53] xfun_0.56 qvalue_2.38.0
[55] MatrixGenerics_1.18.1 withr_3.0.2
[57] BiocManager_1.30.27 fastmap_1.2.0
[59] callr_3.7.6 digest_0.6.39
[61] R6_2.6.1 gridGraphics_0.5-1
[63] textshaping_1.0.4 colorspace_2.1-2
[65] dichromat_2.0-0.1 RSQLite_2.4.5
[67] R.methodsS3_1.8.2 utf8_1.2.6
[69] generics_0.1.4 httr_1.4.7
[71] S4Arrays_1.6.0 whisker_0.4.1
[73] pkgconfig_2.0.3 gtable_0.3.6
[75] blob_1.3.0 S7_0.2.1
[77] htmltools_0.5.9 fgsea_1.32.4
[79] scales_1.4.0 png_0.1-8
[81] ggfun_0.2.0 rstudioapi_0.18.0
[83] tzdb_0.5.0 reshape2_1.4.5
[85] rjson_0.2.23 nlme_3.1-168
[87] curl_7.0.0 cachem_1.1.0
[89] stringr_1.6.0 BiocVersion_3.20.0
[91] parallel_4.4.2 restfulr_0.0.16
[93] pillar_1.11.1 grid_4.4.2
[95] vctrs_0.7.0 promises_1.5.0
[97] evaluate_1.0.5 cli_3.6.5
[99] compiler_4.4.2 Rsamtools_2.22.0
[101] rlang_1.1.7 crayon_1.5.3
[103] labeling_0.4.3 ps_1.9.1
[105] getPass_0.2-4 plyr_1.8.9
[107] fs_1.6.6 stringi_1.8.7
[109] viridisLite_0.4.2 BiocParallel_1.40.2
[111] lazyeval_0.2.2 GOSemSim_2.32.0
[113] Matrix_1.7-4 hms_1.1.4
[115] patchwork_1.3.2 bit64_4.6.0-1
[117] KEGGREST_1.46.0 SummarizedExperiment_1.36.0
[119] igraph_2.2.1 memoise_2.0.1
[121] bslib_0.9.0 ggtree_3.14.0
[123] fastmatch_1.1-8 bit_4.6.0
[125] ape_5.8-1 gson_0.1.0